#HalloweenViz exercise: Viz this data, get Tableau swag

Note: The following is a guest post by Tableau Zen Master Jeffrey Shaffer.
I have lived in my house for 14 years. And every Halloween, I get inundated with trick-or-treaters. Year after year, it's like Willy Wonka's Chocolate Factory at my house, with candy flying out the door.
Now, being a data guy, what do I do? Well, that's simple—I count them. A friend and I keep meticulous count of the trick-or-treaters in 30-minute intervals. And I've been tracking this data year by year.
After a number of years of recording these numbers, I decided to use it as a data set for training. I've used this data set in the data visualization course at the University of Cincinnati as the first assignment for the students. I’ve also used it for training at KPMG in its Advisory University and Global Analytics, not to mention other workshops and corporate training sessions.
At the time of writing this post, I would estimate that over 1,500 people have created a data visualization using this data. And now it's your turn to have a go and earn some Tableau swag!
Download the data below and create your own viz! Then tweet us your creation @tableau and @HighVizAbility using the hashtag #HalloweenViz, and we’ll send you some swag in the mail.
The data
So let me tell you about the data. There are a number of reasons why I really like this data set, and I've had great success using it as a teaching tool. This very small data set forces people to be creative with the story they tell. It's a fun topic and something most everyone can relate to (at least in the US).
It's always interesting to see the wide range of data visualizations that are created during this exercise. People have analyzed this data along with weather data, sports, crime, economic factors, costume data, price of candy, and many other things.
And there’s lots of it. As you’ll see, in 2011, I had 869 trick-or-treaters come to my house. And last year was the second highest year at 747. (By the way, how many visitors do you think I’ll get this year? Tweet us your prediction for bragging rights, and I’ll share the final count on Oct. 31.)
You can download the data here:
The numbers in data file for Excel are cumulative. And the numbers in data file for Tableau have been unpivoted and are not cumulative.
Additional notes
City and State: Cincinnati, Ohio
Zip Code: 45207
Neighborhood: East Walnut Hills/Evanston (being on the border likely increases the number of trick-or-treaters)
The date for trick-or-treating has always been on Oct. 31 (some neighborhoods change the night for trick or treating).
The type of candy did not vary year by year; it's always a general mix of candy.
Official trick-or-treat hours are from 6 p.m. to 8 p.m., but at 8 p.m., I do not kick the children off my porch and say,"No candy for you." These stragglers trickle down, and by 8:15 p.m., there are no more.
Inspiration
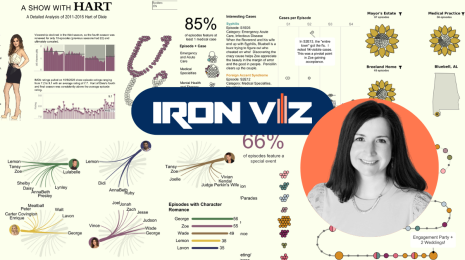
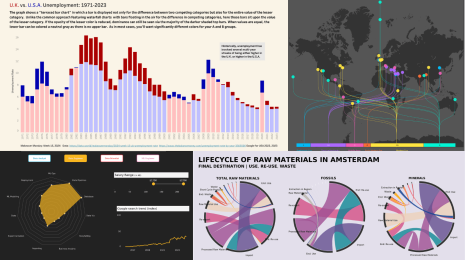
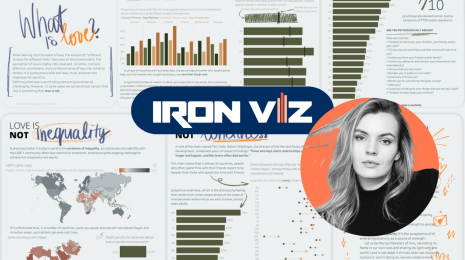
Here are a few examples of what some students have done with this data over the years.


I hope you find this data set useful. If you have any questions, feel free to email me at Jeff@DataPlusScience.com.
For more tips, tricks, and vizzes by Jeff, check out his Tableau Public profile page and his blog. You can also connect with him on Twitter @HighVizAbility.
Zugehörige Storys
Blog abonnieren
Rufen Sie die neuesten Tableau-Updates in Ihrem Posteingang ab.


