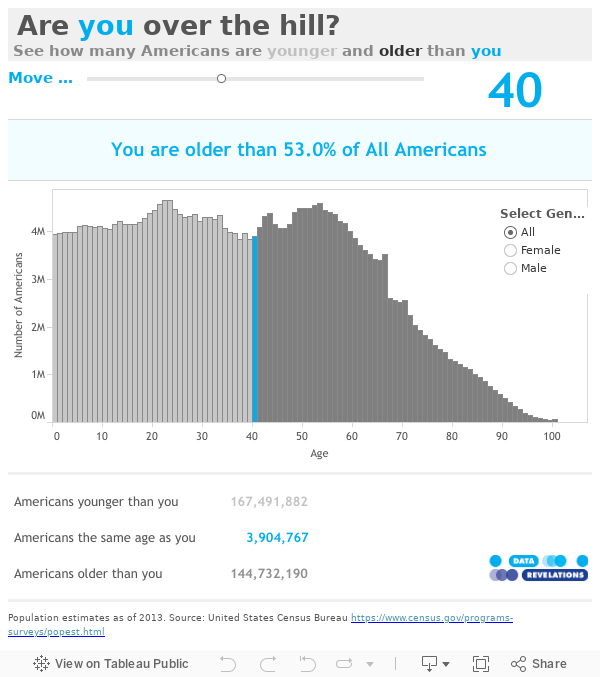
Are you over the hill?
This viz by Steve Wexler is the perfect example of making analytics simple, but not simplistic. Explore to see how your demographics compare with American ages and genders.
Create and share on Tableau Public
Join the newsletter and find daily inspiration with the Viz of the Day. Yours could be featured next!
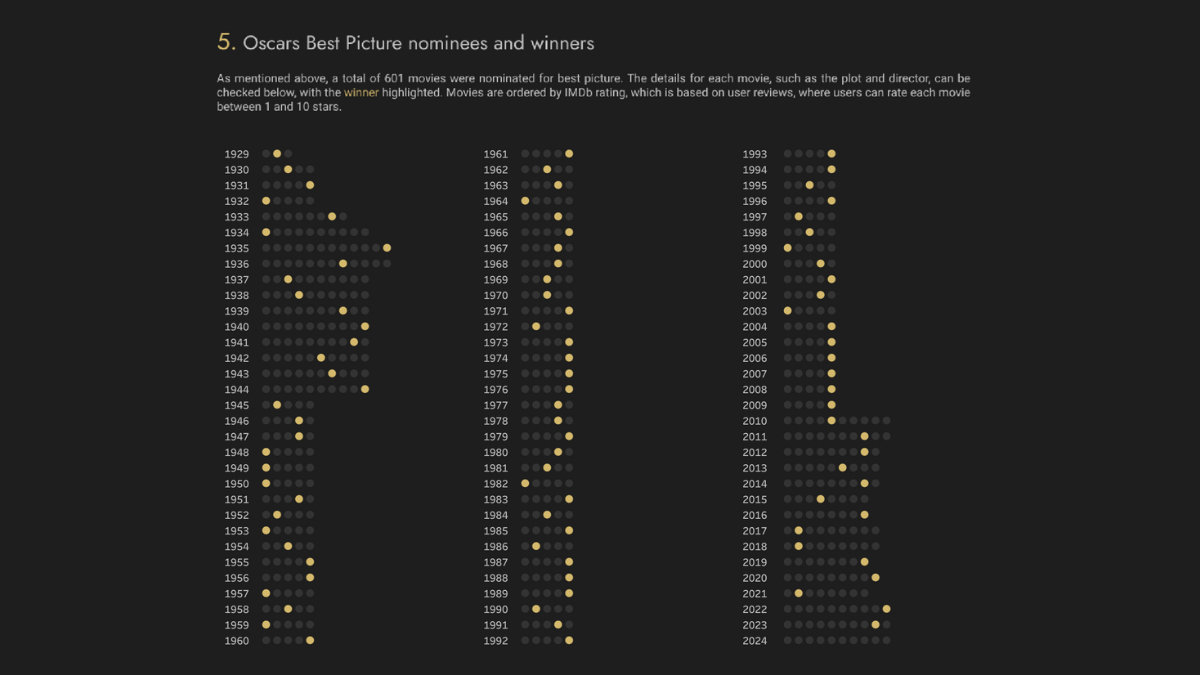
Best Picture 1929-2024
Film awards data never looked so good. Delve into cinematic excellence with Krzysztof Bieniek’s #VizOfTheDay—featuring 601 Best Picture nominees. Explore film awards since 1929 with this #DataPlusMovies entry.
Interact with the viz