DataFam Roundup: June 13 - 17, 2022


Welcome! Dig into this week's DataFam Roundup—a weekly blog that brings together community content all in one post. As always, we invite you to send us your content—and the DataFam content from your peers that have inspired you! Find the content submission form here.
DataFam content
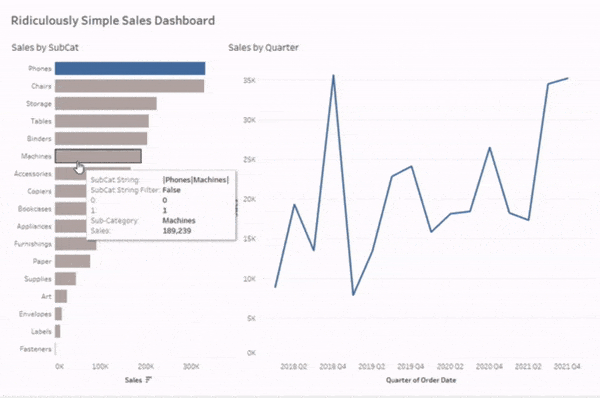
Brian Moore, Do Mo(o)re with Data: Techniques for Filtering on Multiple Selections with Dashboard Actions in Tableau
Dive into content created by the Tableau Community:
- Sarah Nell-Rodriquez, Be Data Lit: Data Literacy is for Everyone: My story of overcoming poverty and gaining data skills
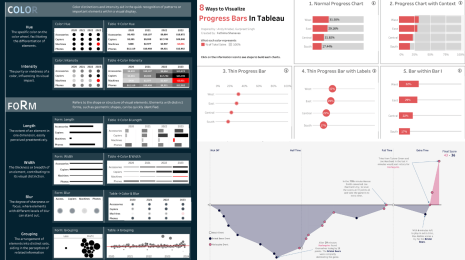
- Vignesh Suresh: Bar Charts: The King of Data Visualization
- Brian Moore, Do Mo(o)re with Data: Techniques for Filtering on Multiple Selections with Dashboard Actions in Tableau
- Jared Flores, What The Viz: Ternary Plot with Reference Lines - Tableau Prep Template
- CJ Mayes: Charting Tennis Games
- Jonathan Drummey and Keith Helfrich, The Sensemaker's Video Podcast: Why did Tableau Invent Relationships?
- Zach Bowders, Data + Love: A conversation with Alex Selby-Boothroyd, Head of Data Journalism at The Economist
- Mick Yang: Meet the Community! Wendy Wang Shijia, data visualization designer, Tableau Public Ambassador and Tableau Visionary
- Actinvision: L’importance de lacommunauté (The importance of Community with Annabelle Rincon - in French)
Pride Month
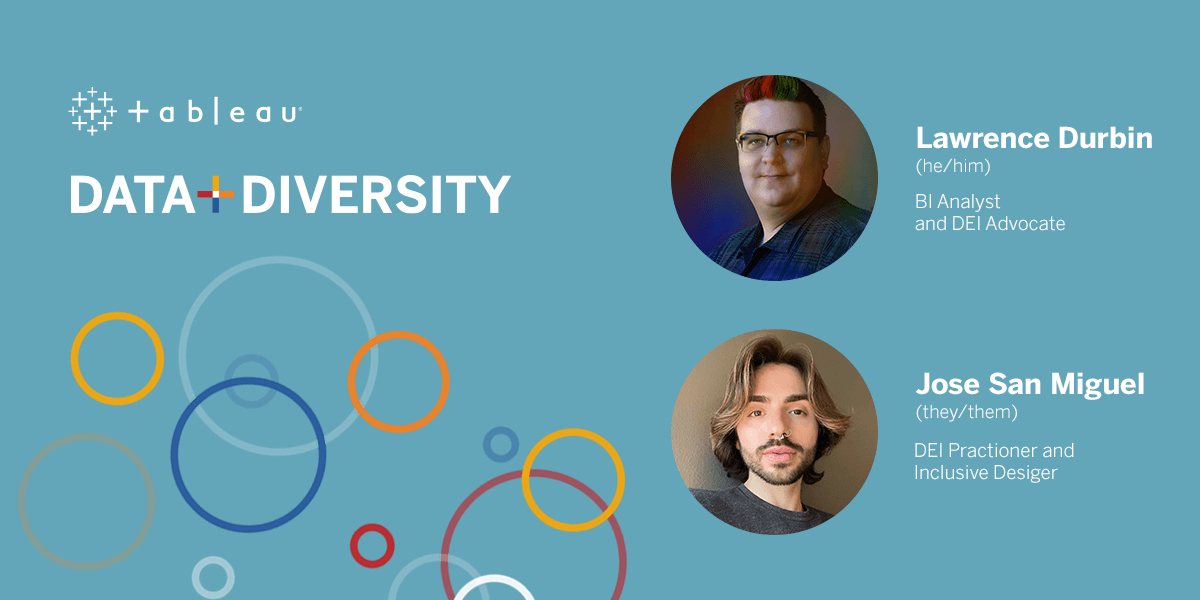
Data + Diversity: Celebrating the impact of the LGBTQ+ community
- Data + Diversity: Celebrating the impact of the LGBTQ+ community: Join the DataFam on June 22nd (9am PDT) to explore the impact and data visualizations of the LGBTQ+ community.
- Join the LGBTQ+ (Data Pride) Tableau User Group: A virtual group focused on highlighting, elevating, and bringing together the LGBTQ+ community in data and its allies.
Upcoming events and community participation
-
My Tableau Story with Visionary Lindsay Betzendahl, June 21: The My Tableau Story series showcases the evolving and inspiring experiences of Tableau Community leaders. People like you who wanted to grow in their data journey. Join us for Episode 4 as we sit down with Community leader and Tableau Visionary, Lindsay Betzendahl.
- Data Leadership Collaborative Braindates, June 23 - 24: Exchange ideas with data leaders from around the world.
- Tableau Community Booster Meetup, June 24, 2022: This space is to celebrate and discover some amazing Tableau Community lead projects. We will start with quick outlines of each project, then you will have a chance to meet the organizers and data artists that lead these exceptional groups during this virtual networking event via Remo.
- Tableau DataFest 2022: It’s time to sharpen your Tableau skills, propel your career forward, and have some fun at a Tableau DataFest in a city near you. Drawing together key sessions from Tableau Conference ‘22 in Vegas with new bespoke demos and deep dives from local customers and partners, Tableau DataFest is your destination for data.
- Stay up to date with the latest and greatest from the Tableau Community. We'll help you along in your Tableau journey, bring your data skills to the next level, and nurture powerful connections.
- Sign up to be a panelist for the 3charts@3 Live: A Mystery Chart Show featuring topics like personal finance, energy, healthcare and more!
- Data Book Club, Summer 2022 Selection: Invisible Women: Data Bias in a World Designed for Men
Vizzes
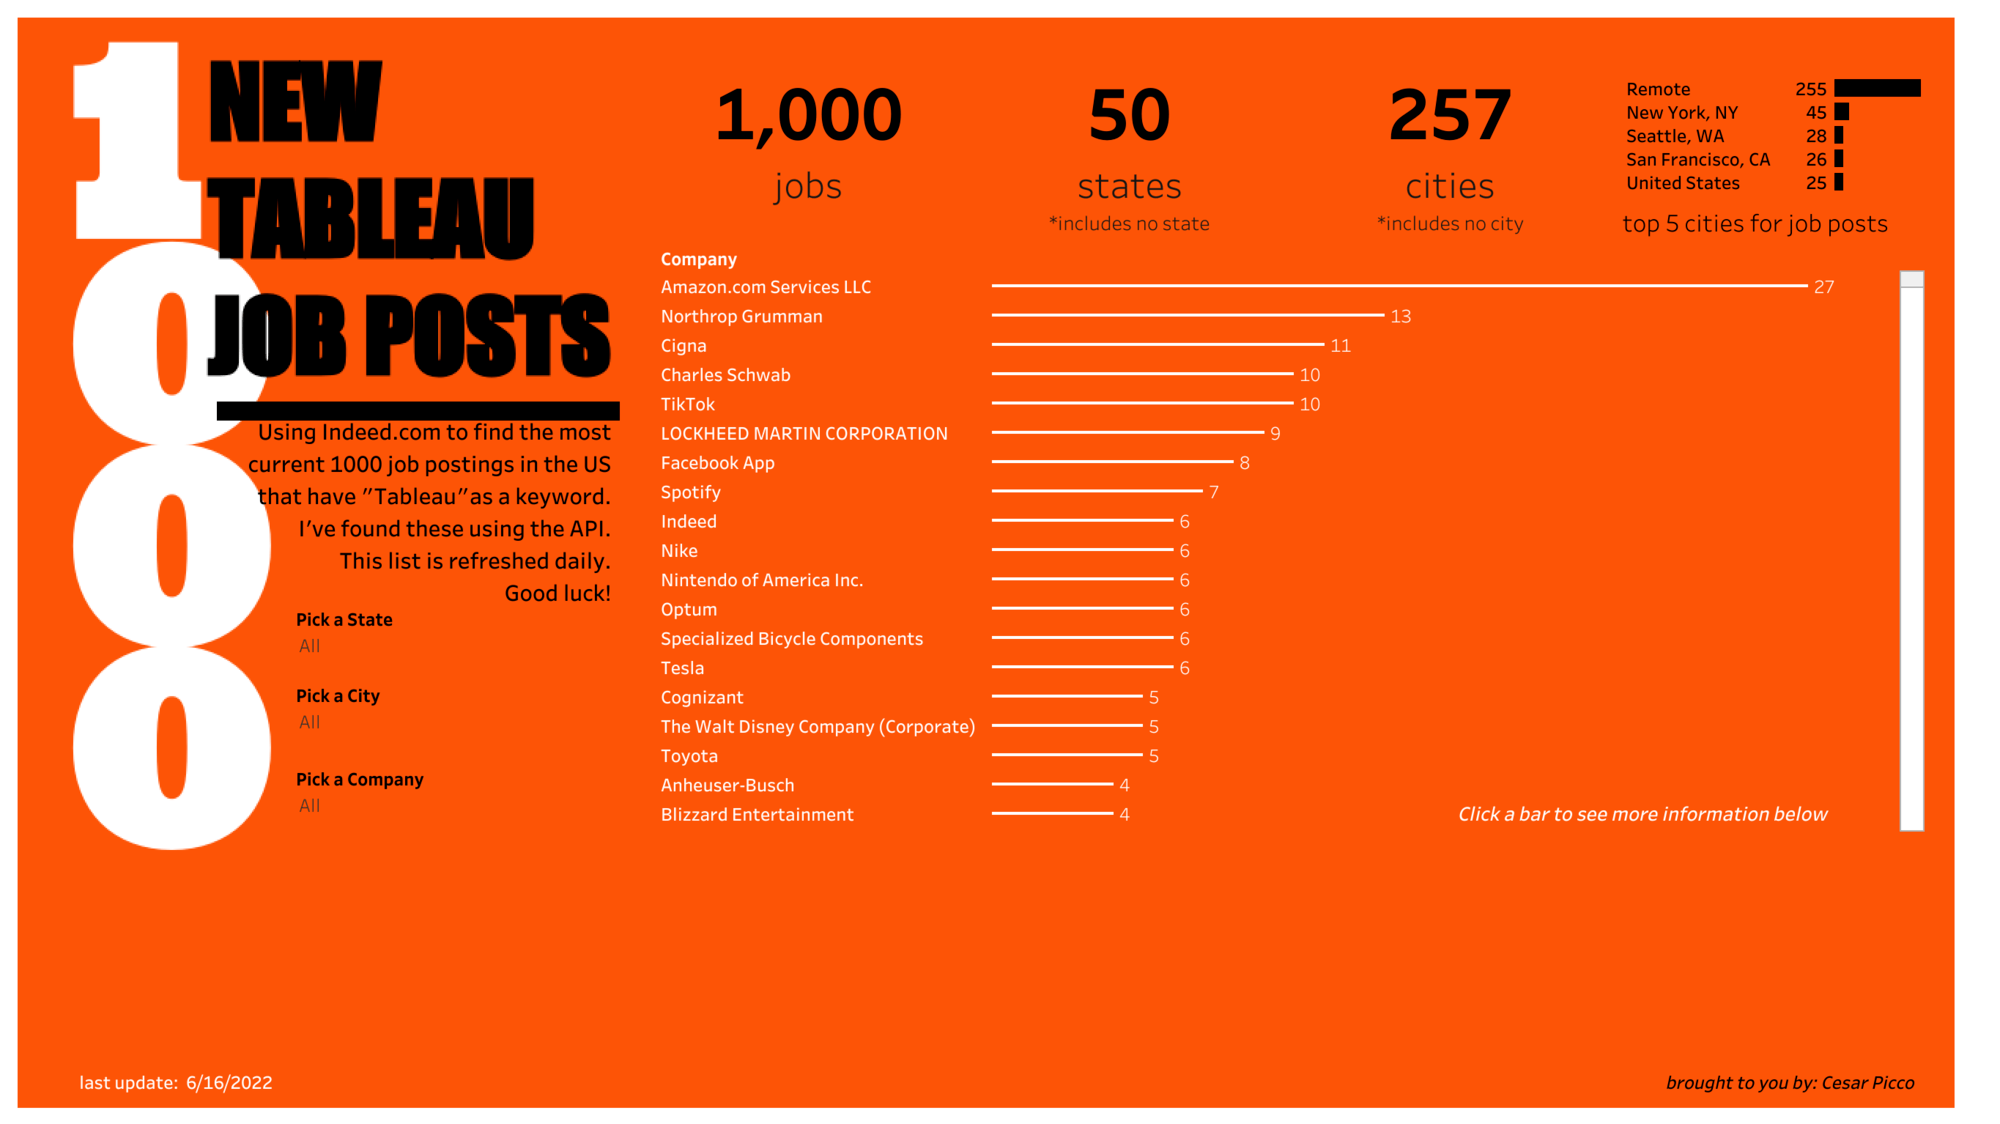
Cesar Picco: 1000 New Tableau Job Posts
See the latest Viz of the Day, trending vizzes, featured authors, and more on Tableau Public.
Check out some inspirational vizzes created by the community:
- Judit Bekker: Severance: Please enjoy each fact equally
- Cesar Picco: 1000 New Tableau Job Posts
- Sam Epley: Stanley Cup Playoff Results & NHL Season Team Statistics
Community Projects
Back 2 Viz Basics
A bi-weekly project helping those who are newer in the community and just starting out with Tableau. Not limited just to newbies!
Web: Back 2 Viz Basics
Twitter: #B2VB
Week 12: Diverging Values
Workout Wednesday
Build your skills with a weekly challenge to re-create an interactive data visualization.
Web: Workout Wednesday
Twitter: #WOW2022
Week 23: Tableau : Prep That and Build This!
Preppin' Data
A weekly challenge to help you learn to prepare data and use Tableau Prep.
Web: Preppin’ Data
Twitter: #PreppinData
Week 24: Longest Flights
DataFam Con
A monthly challenge covering pop culture and fandoms.
Web: DataFam Con
Twitter: #DataFamCon
June 2022: Dungeons and Dragons
EduVizzers
A monthly project connecting real education data with real people.
Web: Eduvizzers
June 2022: Chicago Public Schools – Progress Report Cards (2011-2012)
Data Plus Music
A monthly project visualizing the data behind the music we love!
Web: Data Plus Music
Twitter: #DataPlusMusic
February 2022: MIDI Music Analysis
Games Night Viz
A monthly project focusing on using data from your favorite games.
Web: Games Nights Viz
Twitter: #GamesNightViz
June 2022: Dungeons and Dragons
Iron Quest
Practice data sourcing, preparation, and visualization skills in a themed monthly challenge.
Web: Iron Quest
Twitter: #IronQuest
March 2022: Music Firsts
Storytelling with Data
Practice data visualization and storytelling skills by participating in monthly challenges and exercises.
Web: Storytelling with Data
Twitter: #SWDChallenge
May 2022: Find the exception
Project Health Viz
Uncover new stories by visualizing healthcare data sets provided each month.
Web: Project Health Viz
Twitter: #ProjectHealthViz
June 2022: Monthly Cannabis Exposures
Diversity in Data
An initiative centered around diversity, equity & awareness by visualizing provided datasets each month.
Web: Diversity in Data
Twitter: #DiversityinData
May and June 2022: Diversity in Art
Sports Viz Sunday
Create and share data visualizations using rich, sports-themed data sets in a monthly challenge.
Web: Sports Viz Sunday
Twitter: #SportsVizSunday
June 2022: DataPlusMusic mashup!
Viz for Social Good
Volunteer to design data visualizations that help nonprofits harness the power of data for social change.
Web: Viz for Social Good
Twitter: #VizforSocialGood
Real World Fake Data
Create business dashboards using provided data sets for various industries and departments.
Web: Real World Fake Data
Twitter: #RWFD
Season 2: HR Attrition
Viz 2 Educate
Each month, create vizzes on global education syllabus topics as resources for teachers worldwide.
Web: Viz 2 Educate
Twitter: #Viz2educate
Makeover Monday
Join the community every Monday to work with a given data set and create better, more effective visualizations.
Web: Makeover Monday
Twitter: #MakeoverMonday
SDG Viz Project
Visualize data about Sustainable Development Goals provided by the World Health Organization.
Web: SDG Viz Project
Twitter: #TheSDGVizProject
Related Stories

DataFam Roundup: April 8–12, 2024
 April 12, 2024
DataFam Roundup: April 1–5, 2024
April 5, 2024
DataFam Roundup: March 25–29, 2024
March 29, 2024
Subscribe to our blog
Get the latest Tableau updates in your inbox.