Introducing Tableau Public 10.1


Tableau Public 10.1 is here! And with it comes some great new features to help you do even more with your data. Let me introduce you to Tableau’s clustering feature and native JSON data connector.
Clustering
So what is clustering? Clustering is like grouping—except you let a statistical model decide the groups for you.
Say you’ve got website data. Wouldn't it be great to uncover distinct groups in your audience base and develop targeted content? Or maybe you’re in healthcare. Wouldn’t you like to identify patients who’ve had similar symptoms when investigating effectiveness of treatments?
Complex data can make these questions tough to answer even when you have distinct and well-separated groups. Plus the data is sometimes distributed in such a way that it contains no obvious gaps to distinguish groups via manual inspection.
That's where this new feature comes in. It automatically groups together similar data points. In the example below, you can see the results of clustering countries based on data from the United Nations.
How does this statistical model work? Tableau’s clustering is based on the statistical k-means clustering model. This feature looks at multiple variables then slices your data so the most similar data points are grouped together. Check this video out to see clustering in action.
Need some more inspiration to get you clustering? Have a look at these examples:
- Finding Similar Players for Your Fantasy Football Teams
- How Google Chrome chooses colours on your most-visited page
Want to learn more? Check out these blog posts:
- Primer: What Exactly Is Clustering, and Why Would You Use It?
- Uncover Patterns in Your Data With Tableau 10’s Clustering Feature
JSON Support
JSON stands for JavaScript Object Notation. It’s one of the most common file formats for web based data, and it’s the most common format for API-returned data.
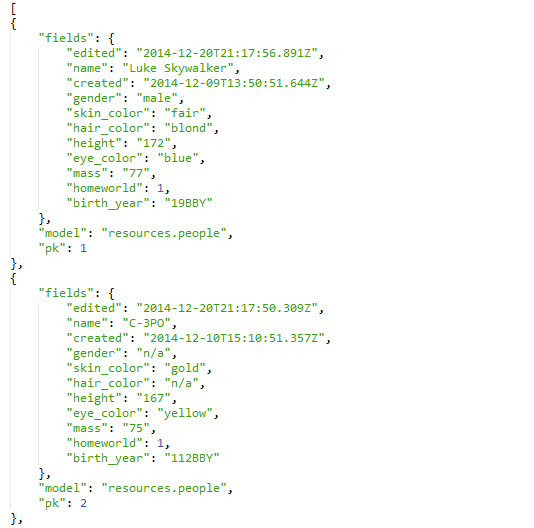
This is a JSON file with information about Star Wars characters.
JSON is a really flexible way to record data, and is used for both simple flat data structures as well as complex hierarchical data. Now you can connect to local JSON files directly and simply specify the hierarchy. This means you can download web-based JSON files and start analysing them right away. Say goodbye to spending ages reformatting them into .csvs!
How to Specify a JSON File’s Hierarchy
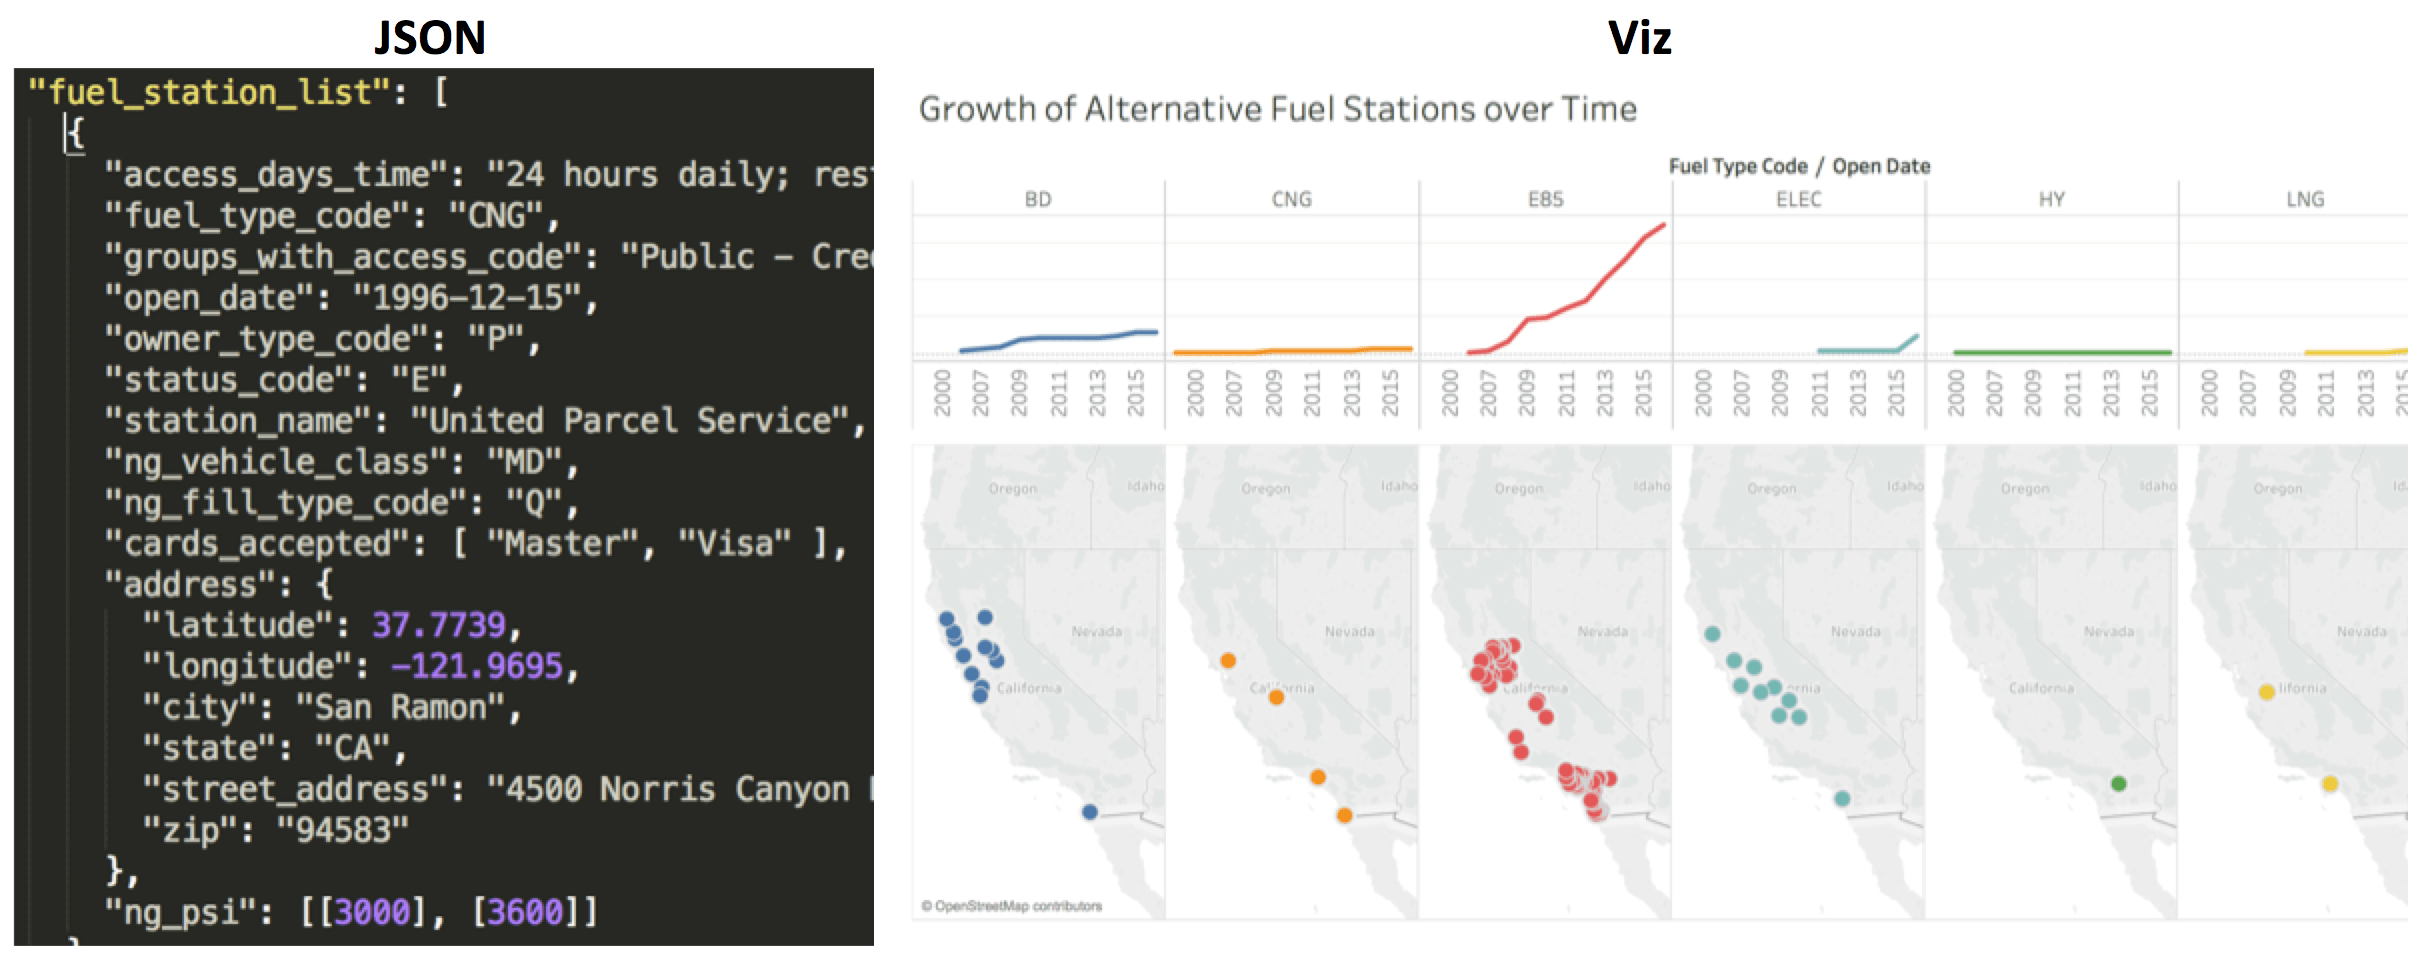
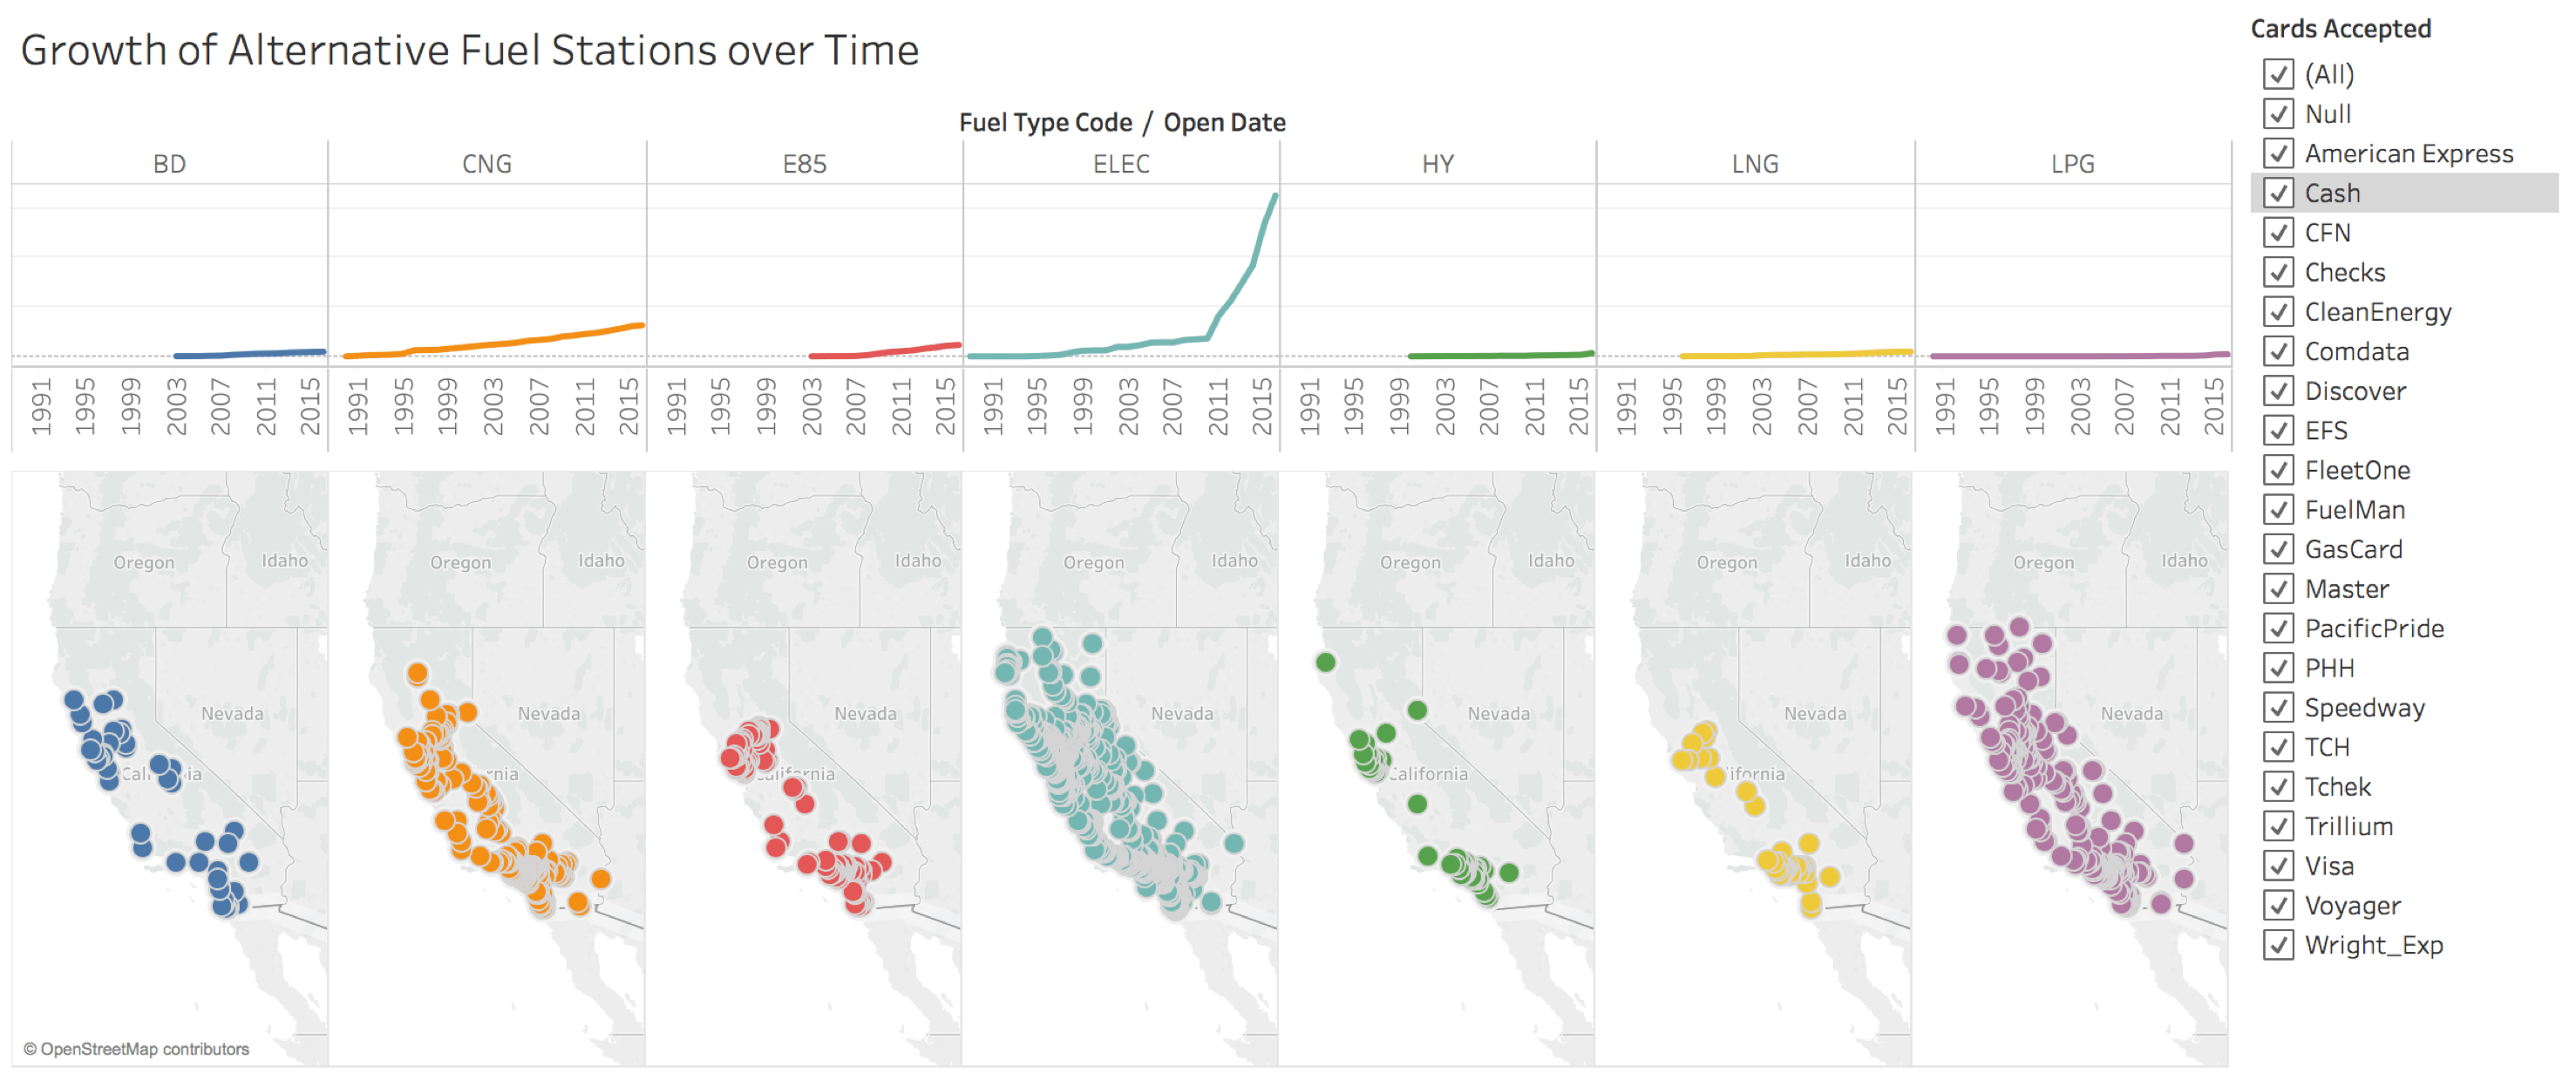
I’ve downloaded a JSON file about alternative fuel stations in California through an API from National Renewal Energy Laboratory. Using Tableau, I can turn the JSON file on the left into an intuitive viz, like the one seen on the right.
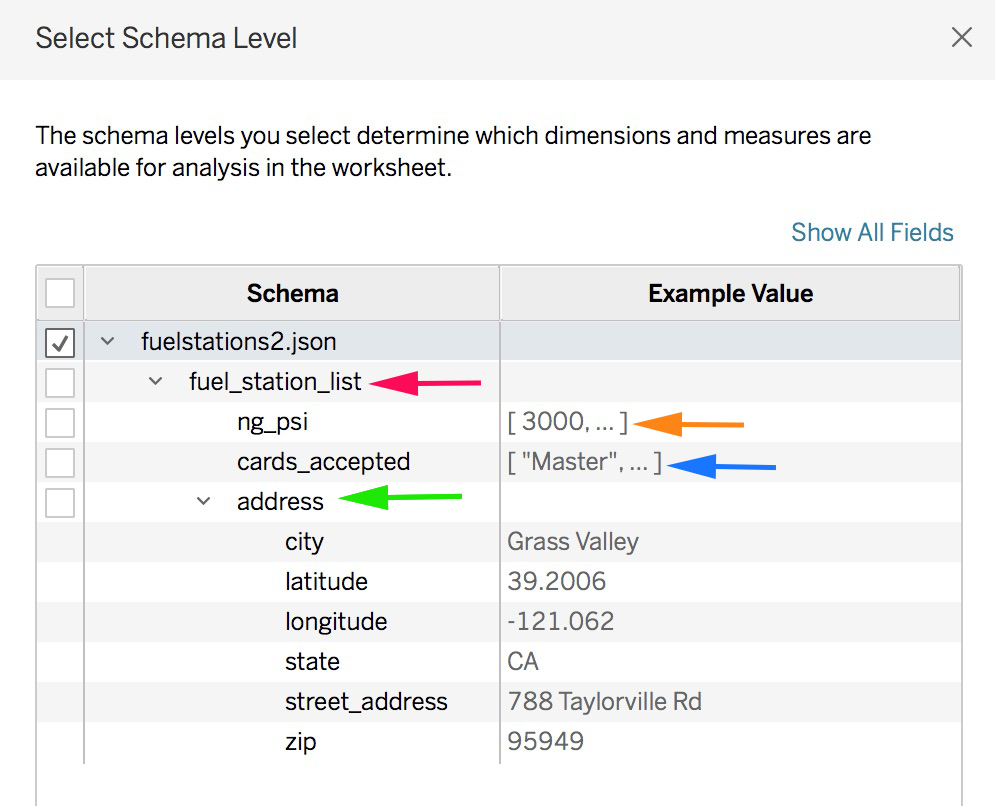
When you look at the file you can see that it’s arranged into four different hierarchical (schema) levels:
- Fuel Station: Information about the station
- Cards Accepted: List of all credit cards accepted by the station
- Address: Location of the station
- PSI: When compressed natural gas is available, this lists the available pressures (PSI) you get from the station
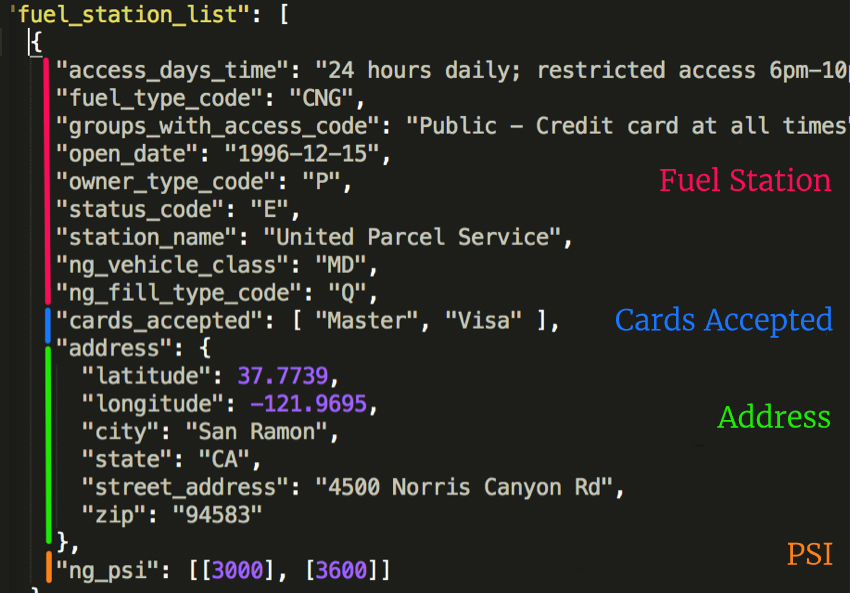
This JSON file is organised into four schema levels
Once I’ve connected the file to Tableau Public, Tableau Public infers the schema and shows me each of these levels. Now all I need to do is pick which levels I want to use for my analysis.
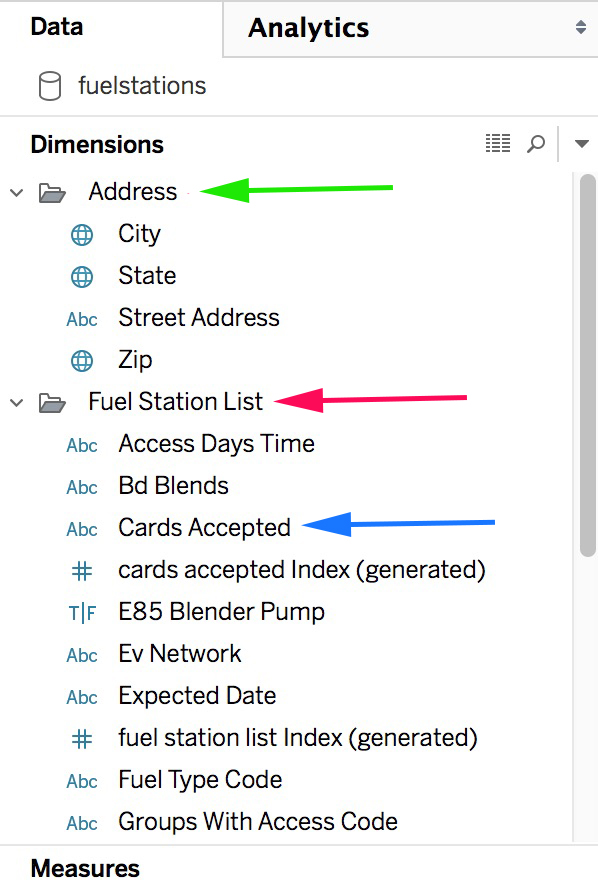
Now let's create a viz! On the data tab, my dimensions are organized by the same levels as the JSON document. It even put the cards_accepted array into the Fuel Station List folder.
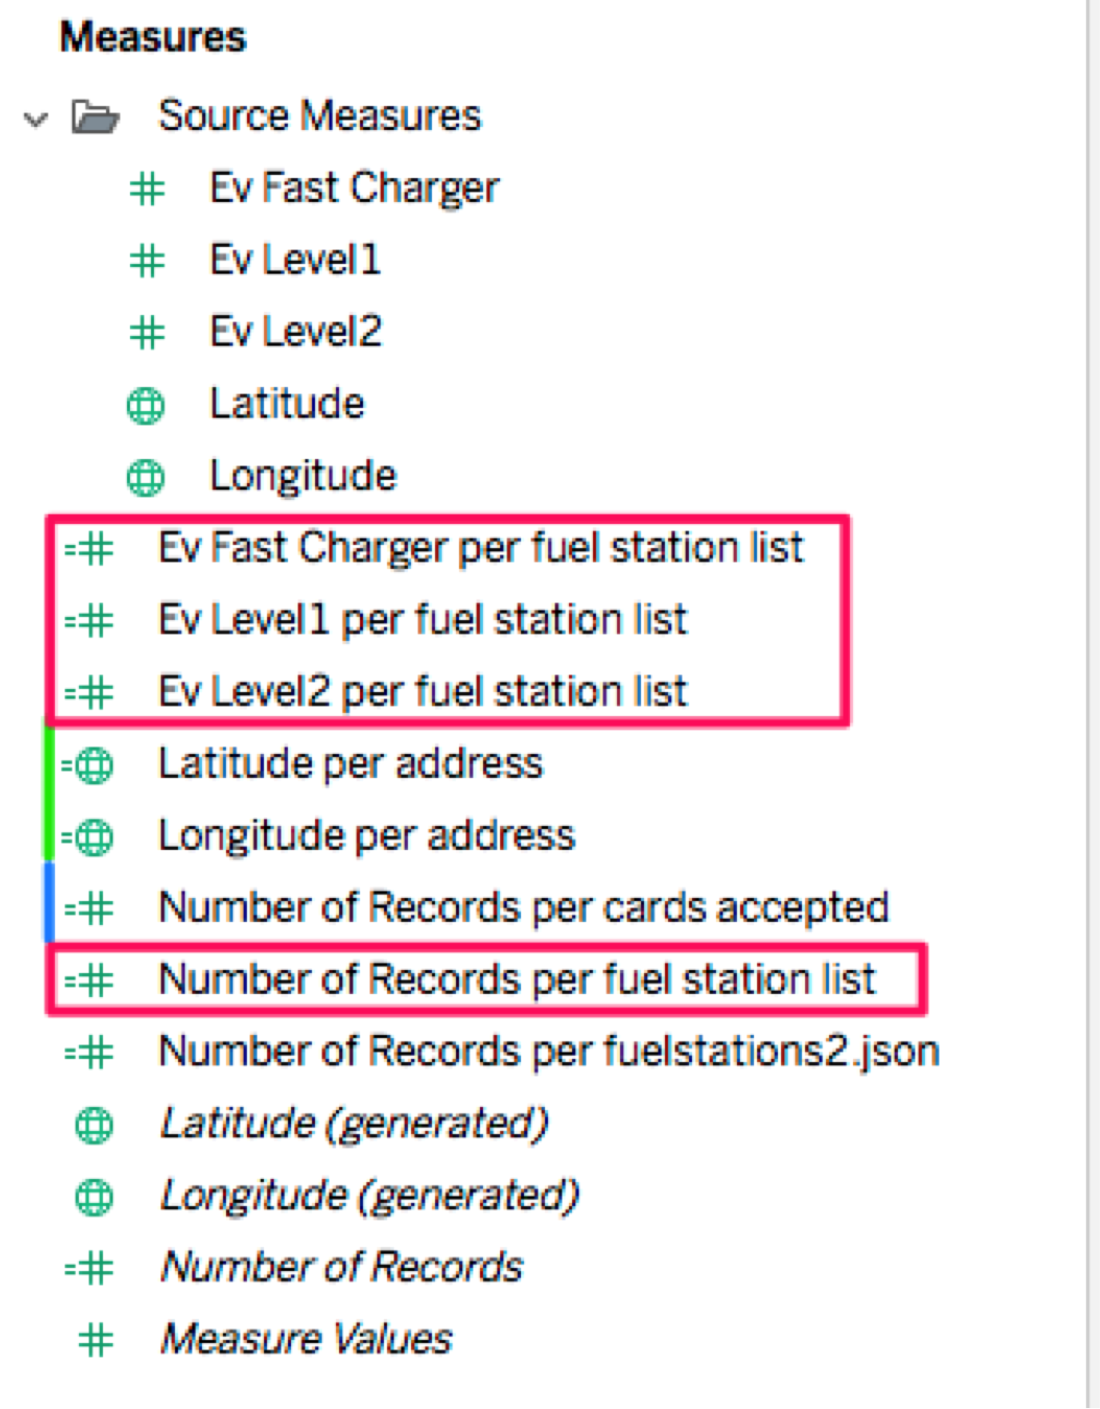
My measures are also named and organized by their schema level. Fuel Station List has four measures that all end with “per fuel station list.” Why did Tableau create these? These measures help me aggregate at the right level of detail.
After creating my viz, I can see how electric charging stations have grown significantly since 2011 and are the widest spread! I can even filter the stations by their payment options.
Want to try connecting to a JSON file yourself? Try out the Star Wars characters data set on our resources page.
Want to learn more about JSON files and Tableau? Check out this blog post: Finding Similar Players for Your Fantasy Football Teams.
Download Tableau 10.1 now and try out these new features!
Related Stories

Meet Iron Viz 2024 Finalist Jessica Moon
 April 15, 2024

Meet Iron Viz 2024 Finalist Pata Gogová
April 8, 2024

Student to BI Analyst, How Tableau Can Lead to a Successful Data Career
 March 20, 2024
Subscribe to our blog
Get the latest Tableau updates in your inbox.