A Year of Blogging with Tableau


This guest post by Iron Viz Finalist Matt Chambers is about how starting a Tableau blog has changed his life over the past year.
I had been using Tableau for around six months when I received an email about registration for TC14 in Seattle. I looked at the list of keynote speakers, reviewed the sessions, and I immediately booked my trip. I had no idea how much my life was about to change. At the conference, I decided to attend Jewel Loree’s session on Tableau Public and blogging. Peter Gilks and Andy Kriebel were on the panel, and they presented some of their visualizations and blog posts. I was completely blown away and more inspired than ever.
Immediately after the session, I went to Andy’s blog, and I noticed that Andy was a Clemson University alum. I couldn’t believe it. Here’s a guy who is a leader in the community, a Zen Master, and he went to the same college that I did. I had to meet him. So I sent him a message on Facebook asking if we could meet. I didn’t really expect him to answer, but to my surprise, he asked me to meet him for breakfast the next day. We had a great talk that morning about being active in the community, and Andy really encouraged me to start my own blog. Jewel’s session and this talk with Andy inspired me so much that I started working on my first viz on the way home on the plane.
I’m a huge sports fan, so naturally my first thought was to do a viz on something I know and like. I’ve always been fascinated with the NFL Combine as it is the ultimate quantitative test for the players going into the NFL Draft. I wanted to build a viz that would identify who were the outliers of the combine. I finished the viz and wrote the blog post, but I was apprehensive about putting it out for everyone to see. I think everyone goes through this when they first start creating content that others will critique. I sent Andy a quick email with the blog post, and he encouraged me to post it to Twitter. I did, and Tableau chose it as the Viz of the Day. I was so excited, and at this point I was completely hooked. This viz, my first on Tableau Public still has more views than any of my other visualizations.

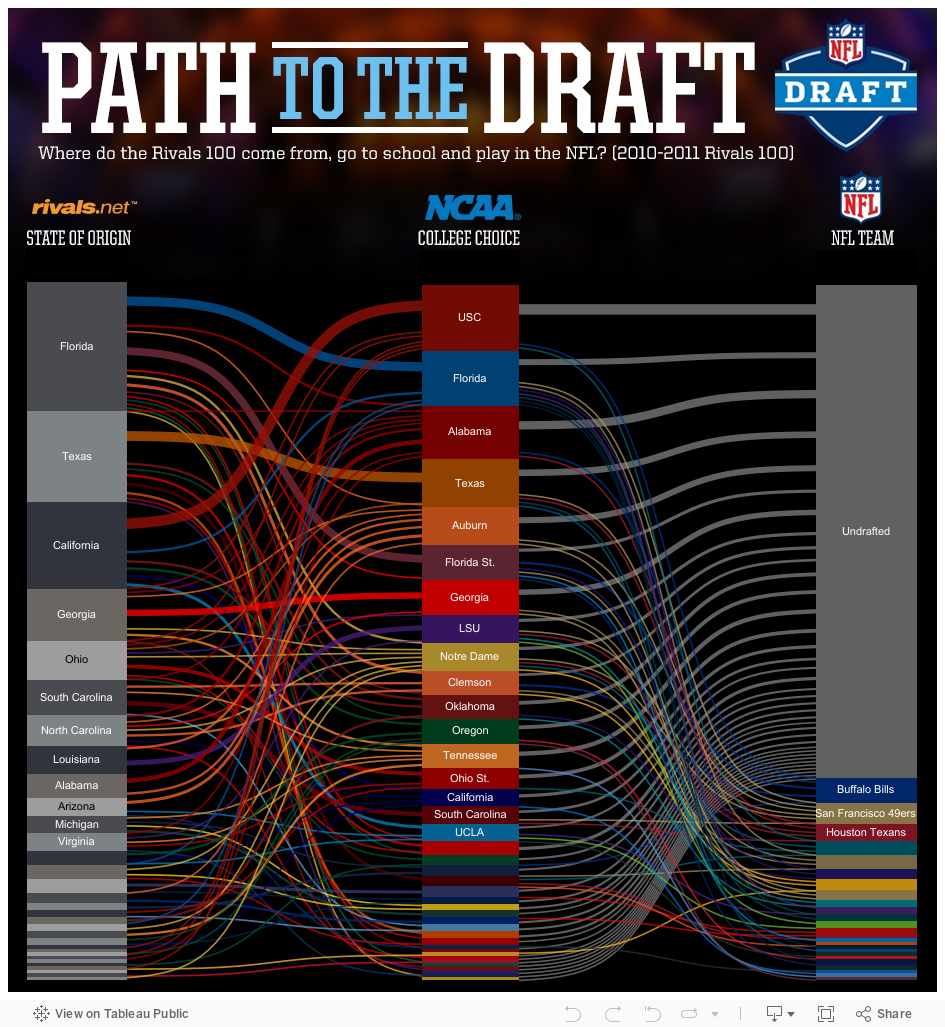
As I started participating in the community, I started to read blog posts on how-to’s and tips and tricks. I would take these posts and try to apply them to visualizations. For example, I used Chris Love’s tutorial on Sankey diagrams to build my Path to the Draft viz.
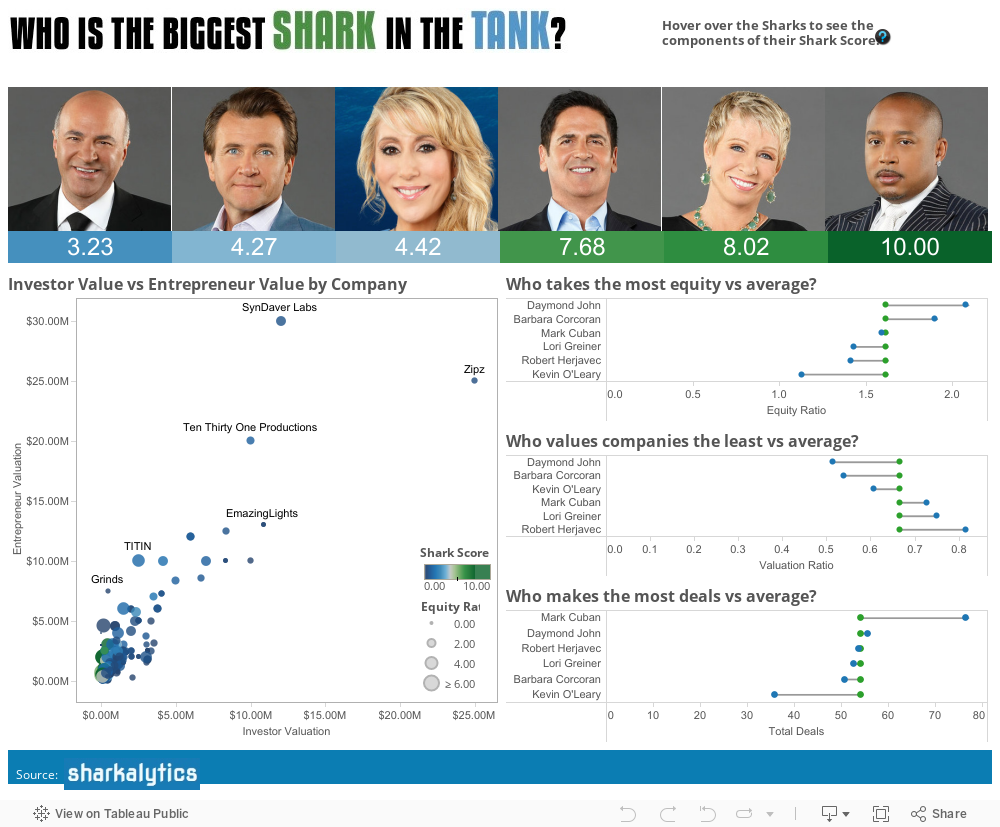
I also used Andy Kriebel’s post on barbell charts to build my Shark Tank viz. By applying the tips and tricks from the community to my Tableau Public work, I gained new skills that are transferrable to professional work as well.
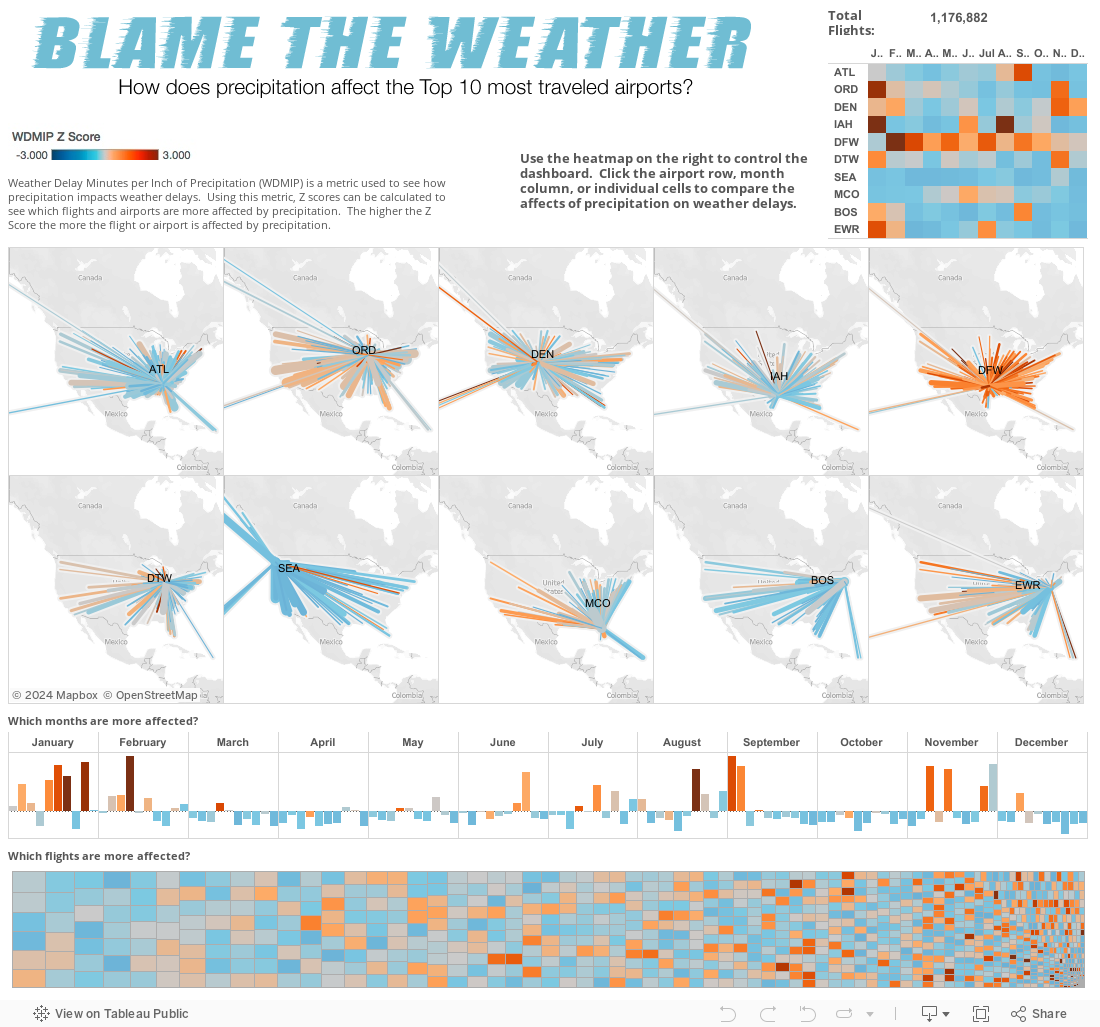
As my skills continued to improve, I decided to enter the 10x Data Iron Viz Contest. Once again, using a tutorial from Ben Jones inspiration, and a little data manipulation magic via Alteryx, I was able to build my Blame the Weather viz which looks at how rain impacts flights from a statistical perspective. I felt really good about my entry, but I was still surprised when I saw the blog post that I had won a spot to compete at the Iron Viz in Las Vegas.
I reached out to John Mathis, 2014 Iron Viz Champion, for his advice on the competition, and he introduced me to Nelson Davis. This ultimately led to me taking a position as an Information Management and Analytics Consultant with Slalom Consulting.
This brings us to TC15 where, to my surprise, I was able to be a panelist on Jewel’s session about Tableau Public and blogging. It was very surreal to be on the panel this year considering just one year ago I was in the crowd. We had a great crowd, and new bloggers like Brit Cava were inspired by the session and have emerged since the conference.
Participating in the Tableau community has changed my life tremendously over the last year. I have been able to share my work with thousands via Tableau Public, build a portfolio of visualizations I can share, contribute to Tableau Public as a featured author, compete in the Iron Viz, start a new career, contribute back to the community via my blog, and help new bloggers contribute as well. I love telling my story because so many from the community helped me over the last year, and I want to inspire others to participate. There is no better community in all of software than the Tableau community.
Related Stories

Meet Iron Viz 2024 Finalist Jessica Moon
 April 15, 2024

Meet Iron Viz 2024 Finalist Pata Gogová
April 8, 2024

Student to BI Analyst, How Tableau Can Lead to a Successful Data Career
 March 20, 2024
Subscribe to our blog
Get the latest Tableau updates in your inbox.