Power your analytics advantage—new product innovations from Tableau Conference 2022


At Tableau Conference 2022, the opening keynote was packed with new innovations that bring data everywhere to everyone. This is the time for data—and the time to accelerate the Tableau mission to help people see and understand data. And what better way to celebrate the #DataFam getting together in person than with seven product demos in one keynote? (Pretty sure that’s a record for Tableau.)
In his opening remarks, President & CEO Mark Nelson talked about how the changes in the world around us is making data more important and more valuable than ever. Data doesn't just point you toward the answer, data is the answer. And to help everyone get actionable insights from their data, your analytics need to be accessible, powerful, and easy to use.
Let’s take a look at the product innovations from TC22, and how they’ll help power your analytics advantage.
Introducing Tableau Cloud, the premier analytics experience
Tens of thousands of customers are using Tableau Online to deliver analytics in their organizations and with their partners. And the cloud transition is accelerating—data is moving to the cloud like never before, and customers are looking to the cloud to scale analytics faster. In fact, today, nearly 70% of new Tableau customers start their analytics journey in the cloud for the scale, speed, customization, and connectivity the cloud offers. And some of our largest customers have gone all in on the cloud.
There’s never been a more relevant time to introduce Tableau Cloud, the next generation of Tableau Online. This is the fastest way for customers to get the full value of Tableau at enterprise scale—IT gets more efficiency, security, and simpler management, while the business is empowered with anywhere, anytime access to their data.
In back-to-back demos, Product Director Alexzandra Caldwell-Wenman and VP of Product Kitty Chou showed the audience what’s new and coming soon to Tableau Cloud.
Tableau Accelerators are ready-to-use, fully customizable templates that help organizations get insights and value from their data fast. You now have access to more than 100 Accelerators for use cases spanning a wide variety of industries, departments, and enterprise applications. To get started, check out the Tableau Exchange—and soon, you’ll be able to browse and launch Accelerators from directly within the product.
Publicly share dashboards with non-licensed Tableau users. Now you can go beyond your enterprise and share key insights publicly with any user. It’s easy to share and easy to embed your work in a public-facing website—coming to Tableau Cloud later this year.
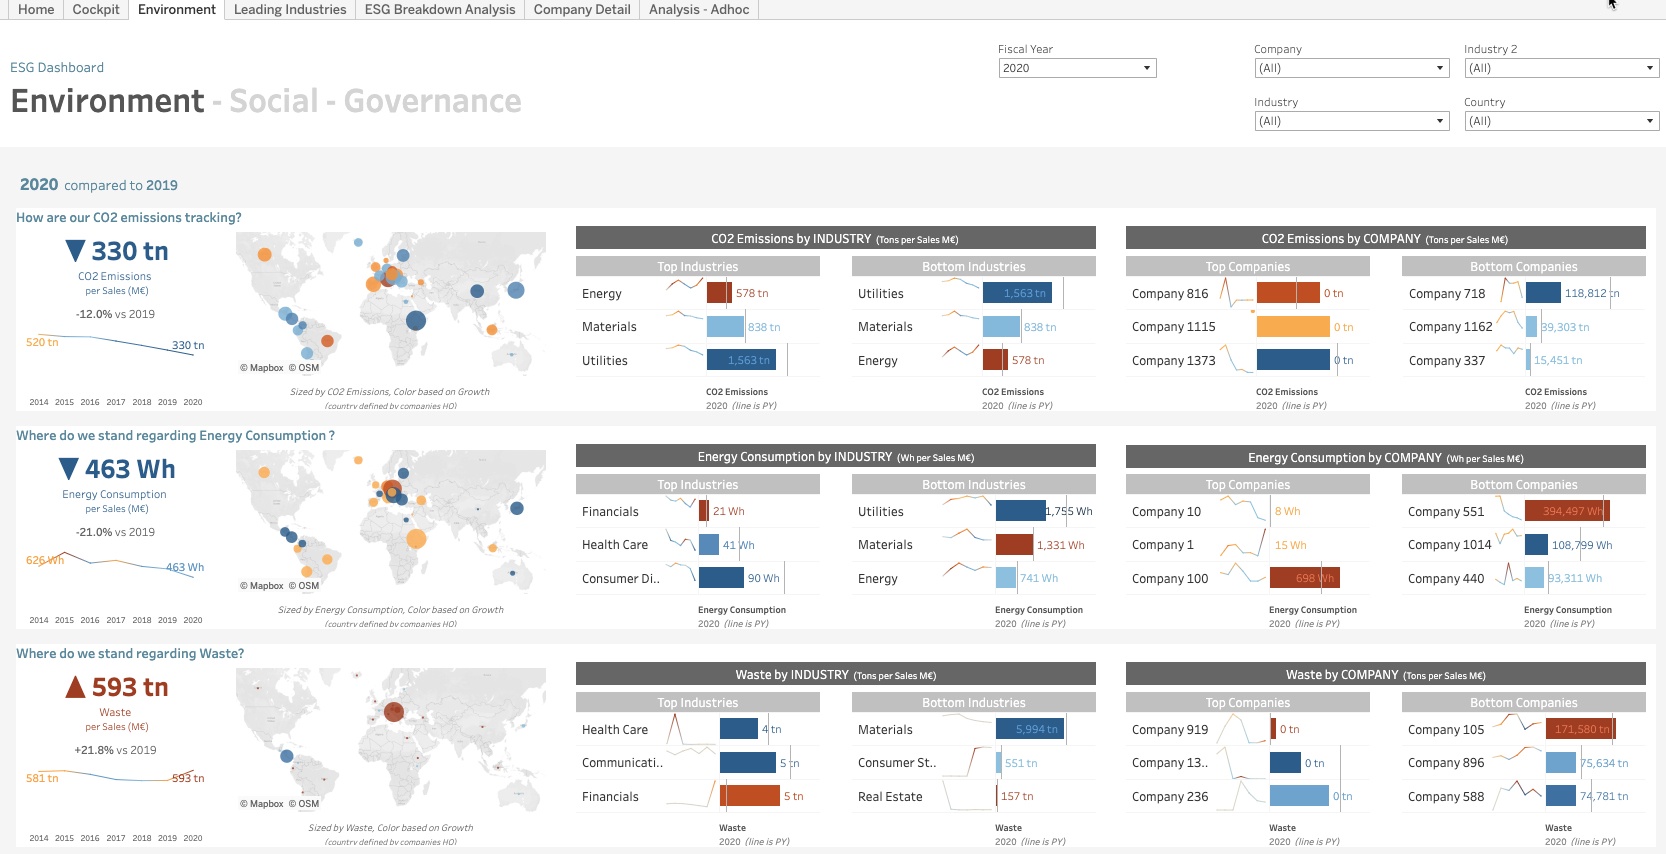
Alex showed how quickly JetBlue could populate their Salesforce Net Zero Cloud data into the pre-built ESG Accelerator and share it publicly to demonstrate their sustainability efforts to external stakeholders and customers.
Tableau Advanced Management brings together manageability, security, and scalability features for customers running Tableau in mission-critical use cases. Administrators can leverage these highly configurable capabilities to boost security, simplify management, and scale analytics across the enterprise.
- Customer-managed encryption keys offer more flexibility and control with additional layers of security to meet compliance requirements.
- Activity Log exposes events in your analytics environment and provides detailed data to help you keep track of how people are using Tableau. This also enables permission auditing, a critical aspect in implementing controls over your enterprise deployment.
- Admin Insights help administrators maximize performance, drive adoption, and manage content at scale with data about workbooks, scheduled job performance, and more. Plus, additional data retention will help admins get better insights over longer periods of time.
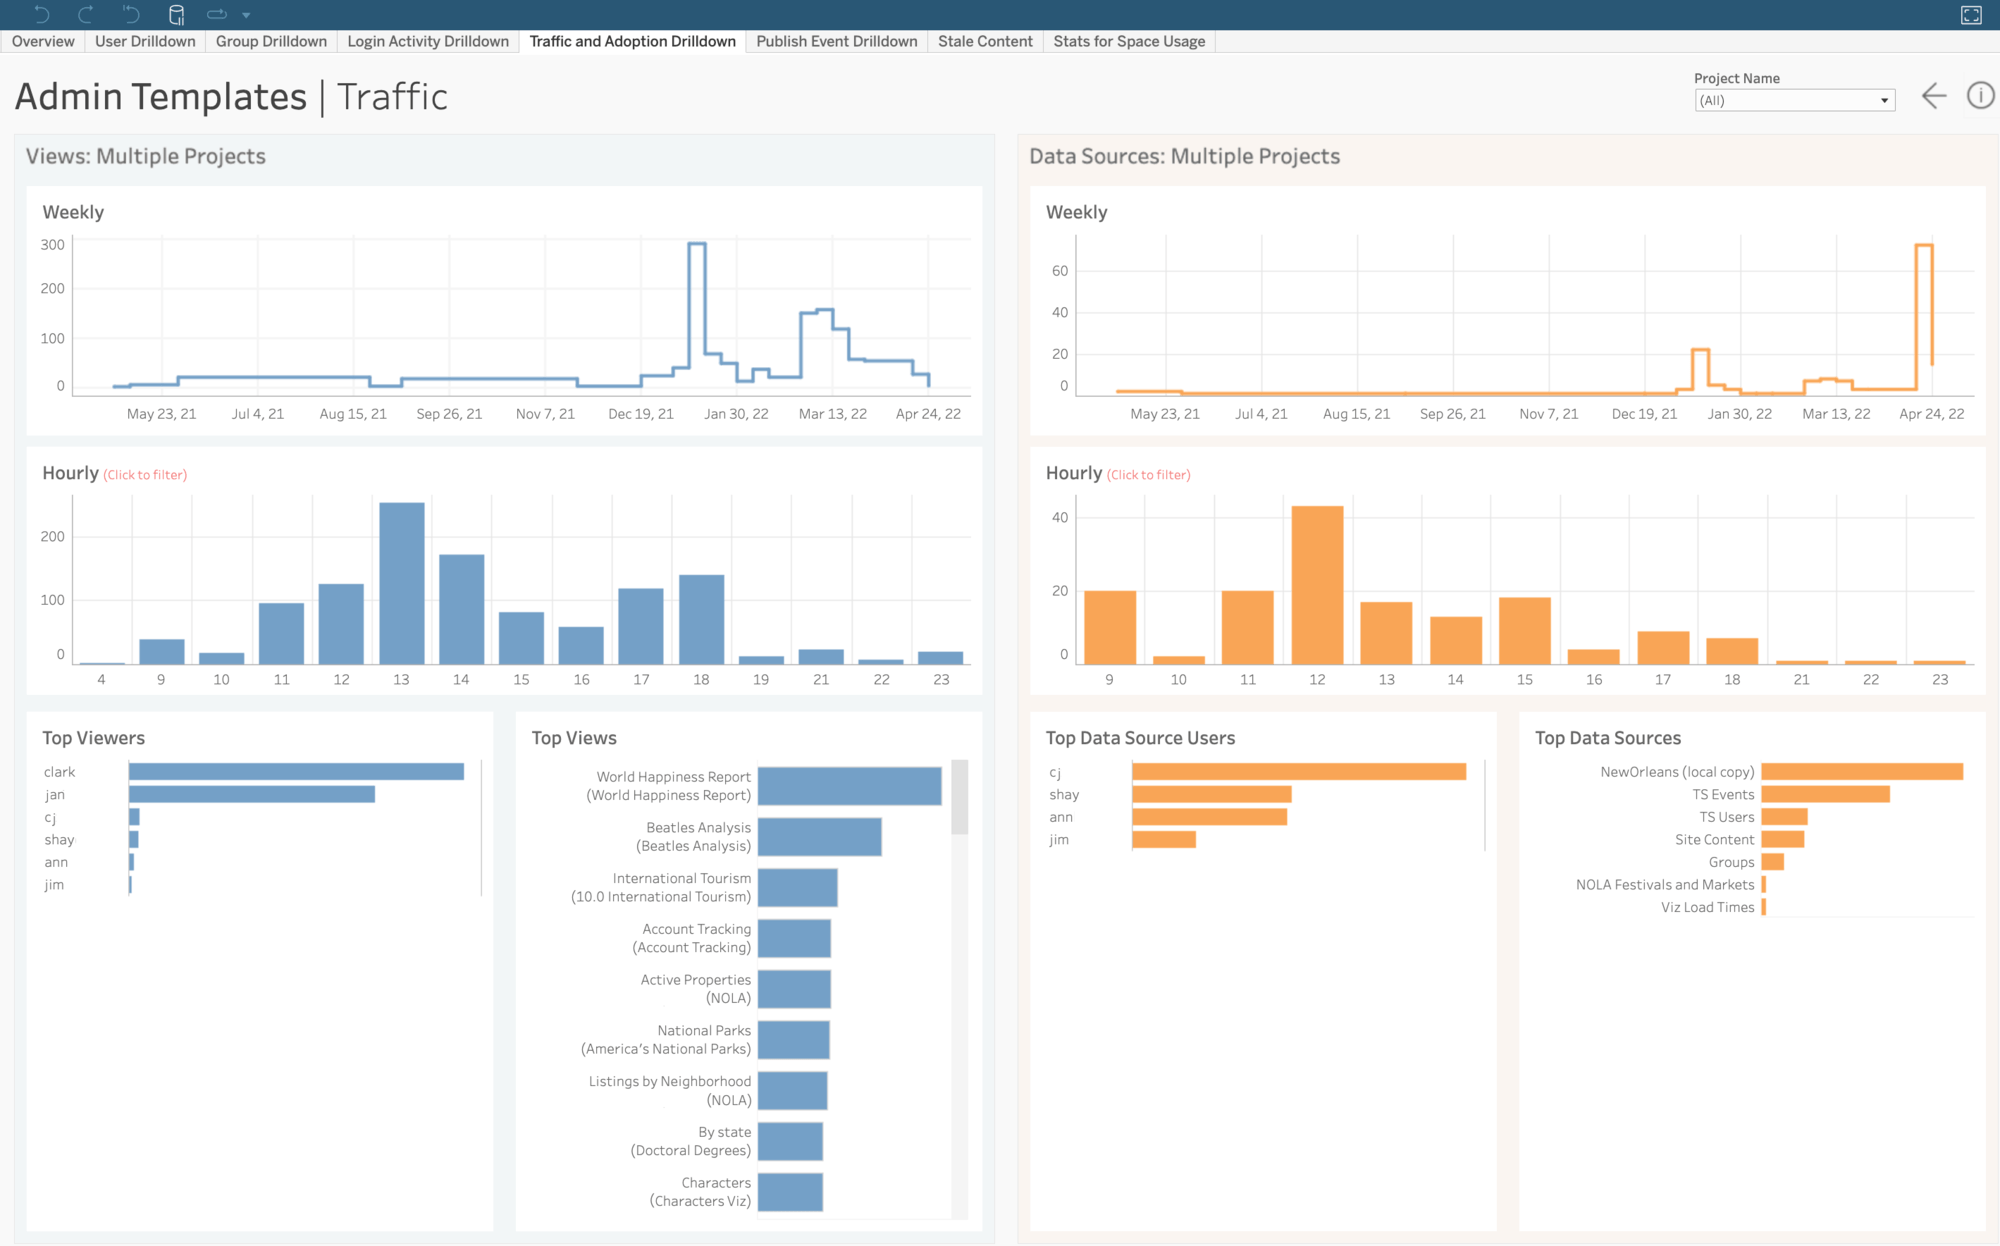
Admin Insights offer Kitty valuable data about users and content across her organization's Tableau Cloud sites. She showed us how she can identify stale content and work with authors to improve performance.
The cloud is where the latest Tableau innovations will land first, but we understand that many customers are at different places on their cloud journeys. Flexibility and choice are core Tableau philosophies—and that includes supporting your analytics if you’re deployed on-premises or self-managed in a public cloud.
Empowering more people to use data with confidence
The early days of Tableau were kind of like the punk rock movement. Data was a little underground, and it brought together a passionate community that felt connected to something energizing. Although data has now hit the mainstream, there are still too few people that can access data and confidently use it in their work. One impactful way to make analytics more approachable—and more powerful—is with AI.
Data Stories help business users get insights fast
Even with the most compelling visualizations, it’s not always obvious what’s important to take away from analyzing your data. Product Director Katie Hughes showed us how AI-powered data storytelling in Tableau will help any user to confidently access, understand, and communicate with data.
Data Stories is a powerful data storytelling feature in Tableau that makes it easy for anyone to understand data. Data Stories automates the analysis, build, and communication of insights to help people understand the “so what” behind their data. Creating a data story is as easy as drag and drop. Data stories are built automatically, but fully customizable, so you can tailor which analyses are included, change the confidence interval, rename fields to contextualize the insights with familiar terms, apply colors to denote positive or negative changes, and more.
Data stories are also dynamic, so when users interact with your dashboard, the language generated in the data story will update to the specific selection. This makes it easy for anyone to explore the data, drill deeper into a story, and uncover the insights that are most valuable to them.
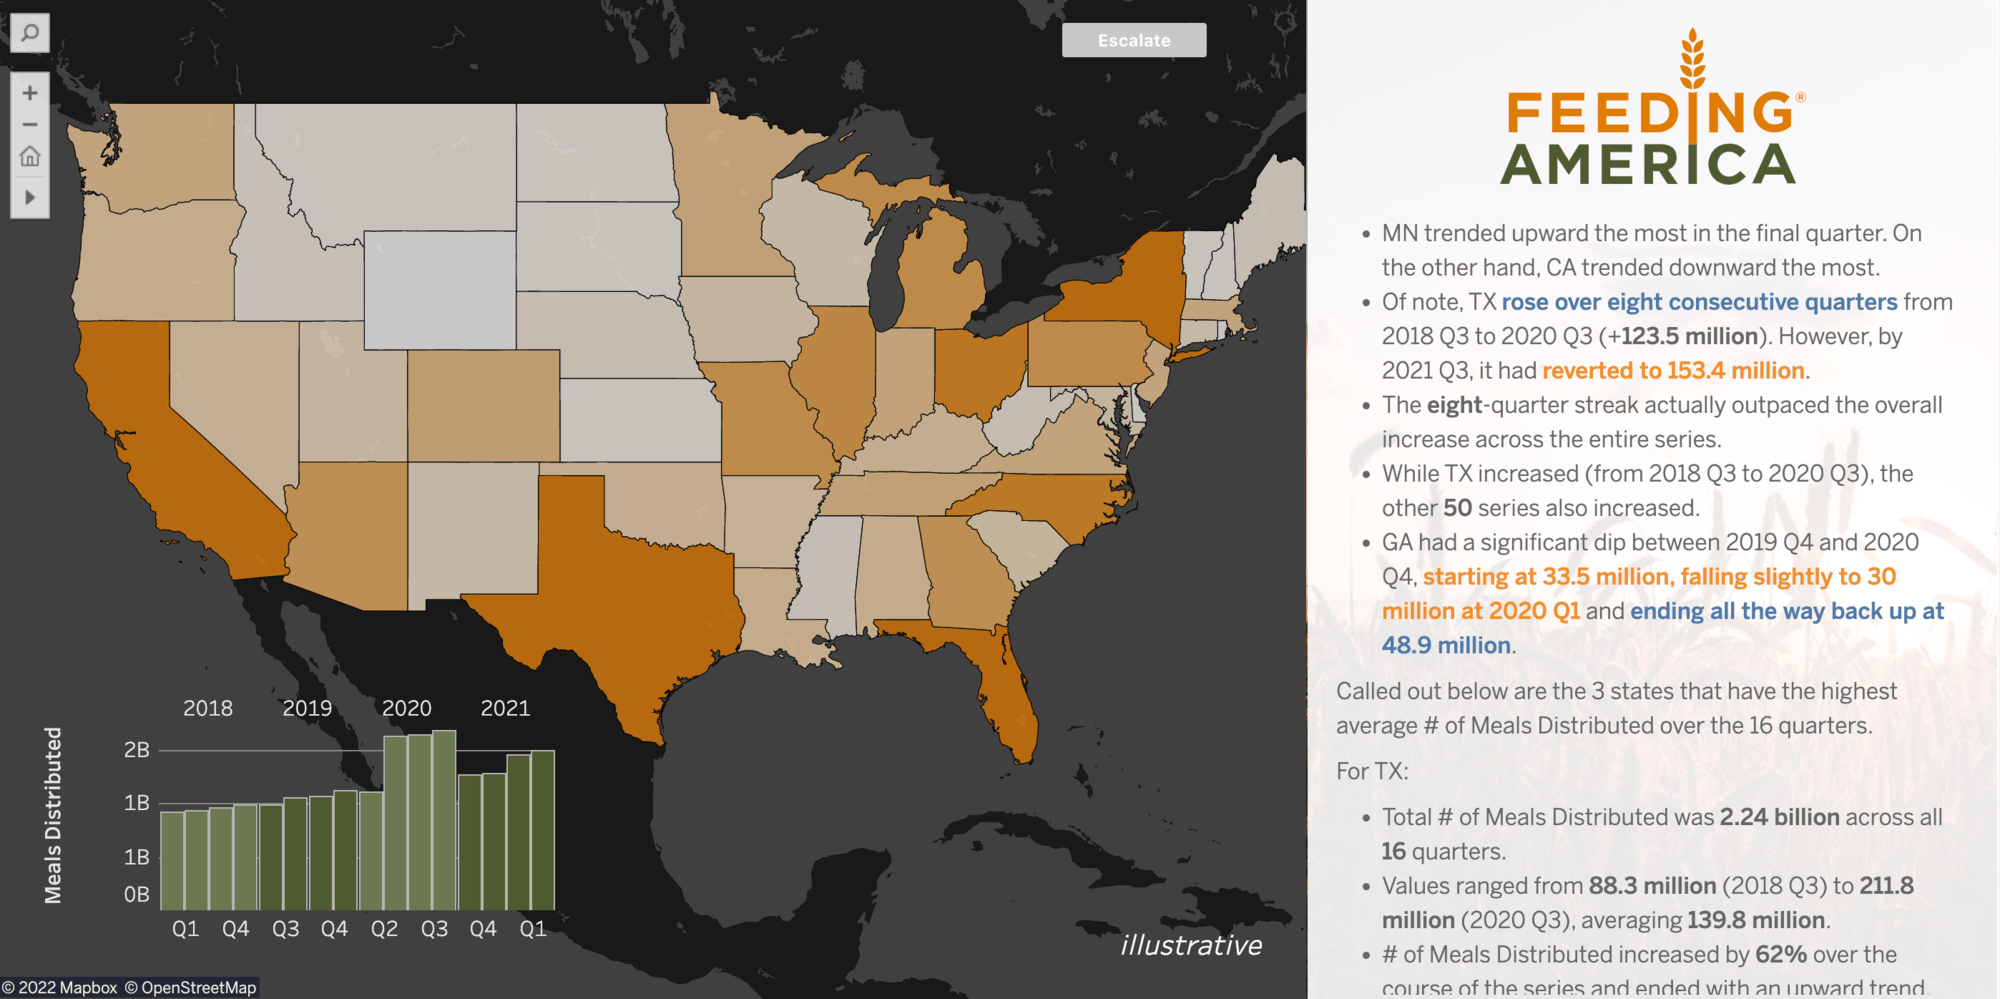
After Katie dragged and dropped the dashboard extension, Data Stories automatically created explanatory text in natural language to communicate insights from the dashboard, like which states drove the most impact toward the overall growth in meals served.
With automated data storytelling, organizations can offer a powerful, yet simple experience to reach more people with data in an approachable and new way. Data Stories are available in beta in Tableau Cloud today, and coming to Tableau Server later this year.
Native model building and scenario planning, powered by Einstein
When analysis was relegated to the specialized few, Tableau democratized self-service analytics. What’s next? A revolution in data science: to empower business domain experts to solve more challenging data problems. Salesforce’s Einstein already powers more than 152 billion predictions and recommendations every day. And now, we’re bringing that power to Tableau customers with exciting, native capabilities.
Product Director Bobby Brill showed everyone new AI-driven features coming to Tableau later this year that will help people go beyond what happened and why, to understand what might happen and what they can do about it.
Model Builder empowers users to create predictive models (linear and tree-based) using clicks not code. Predictive models are now native in Tableau and they are fully integrated with the entire platform. They leverage your data connections, your security and governance, and your user permissions. You can bring these models in your dashboards to get predictions in the flow of analysis. You can also add models to Prep Builder to enrich your data models with predictive insights.
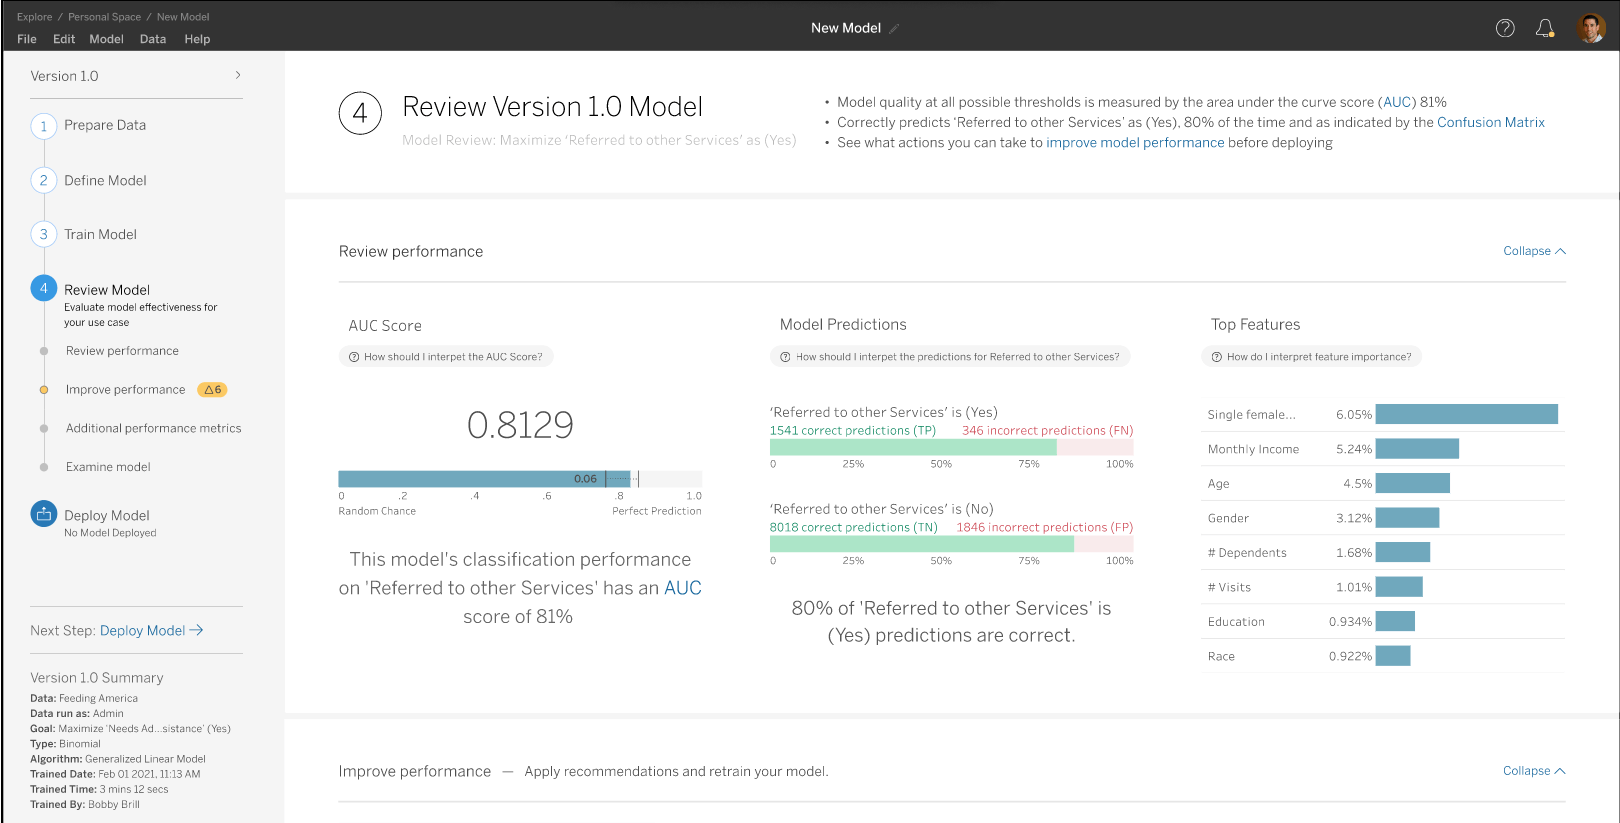
When your predictive model is trained, you can review its performance to see how well it classifies data, and look at the key factors that influence the predictions.
Scenario Planner makes what-if analysis easy, visual, and interactive in Tableau. Beginning with a baseline of historical data, you can leverage parameters to quickly adjust variables and visualize potential outcomes.
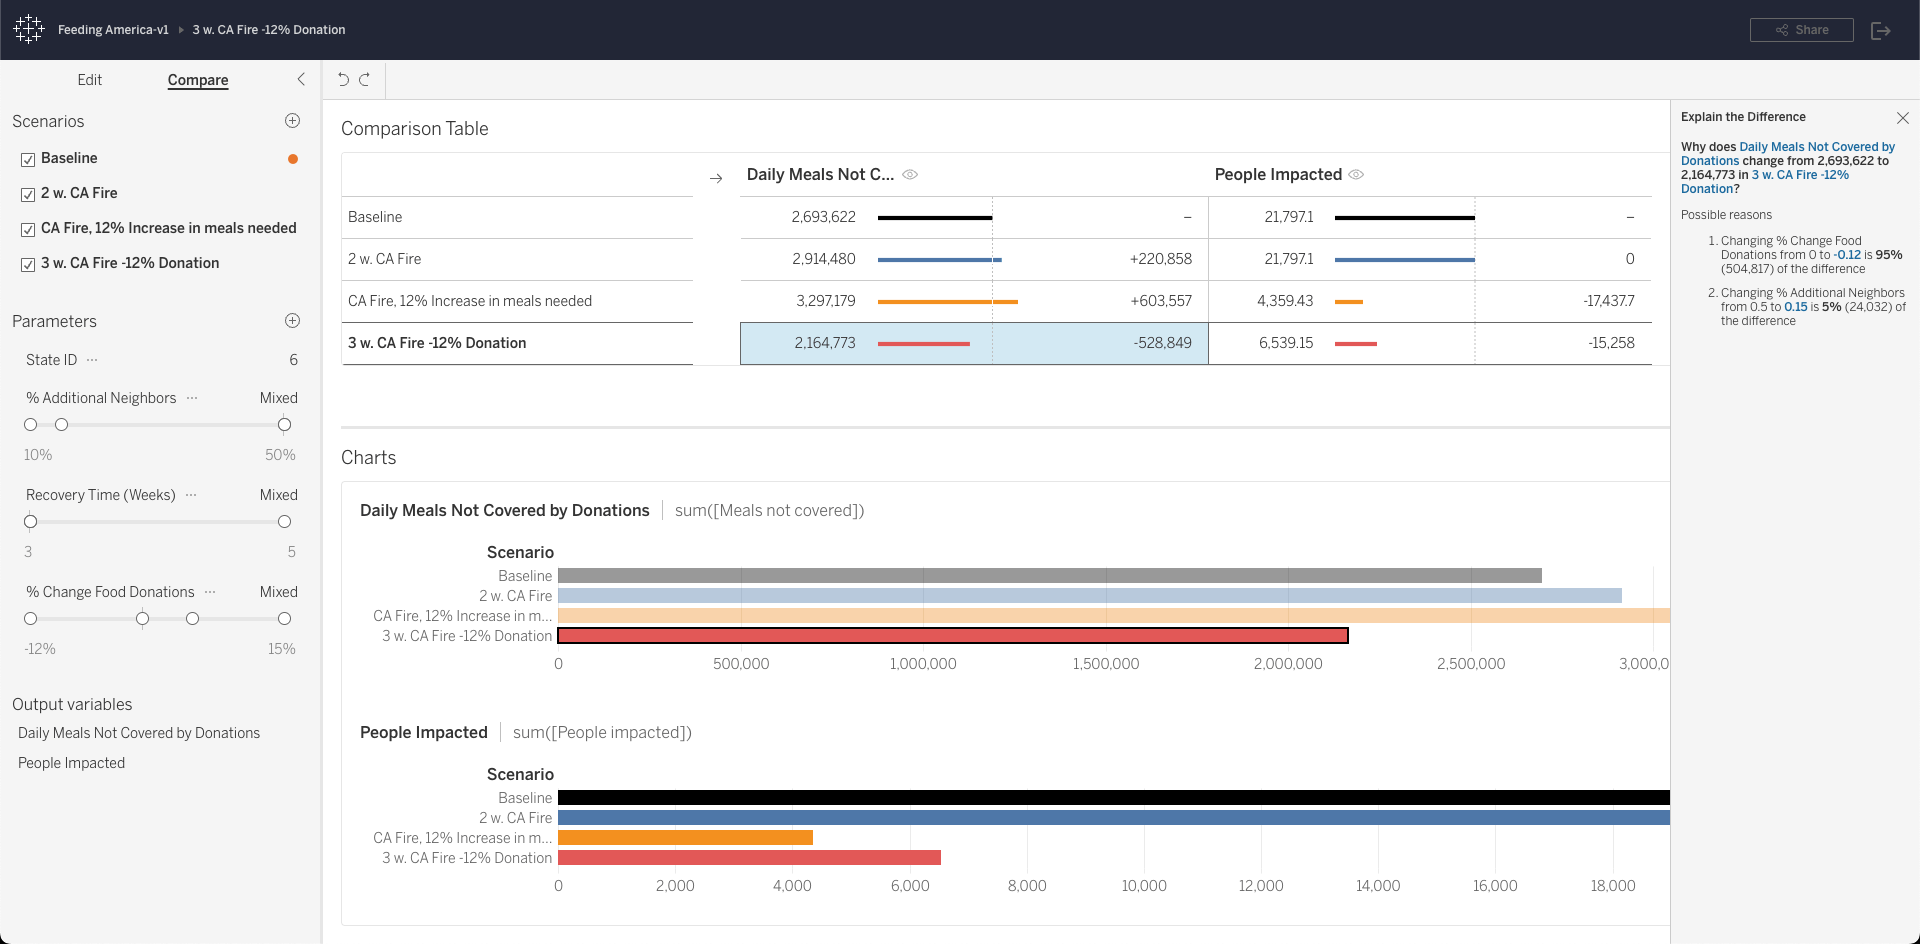
Bobby showed us how Feeding America might use Scenario Planner to explore potential outcomes of a California wildfire and how that could impact the number of people in need of assistance.
Close the gap between insight and action
Finally, Bobby showed us how Tableau is helping people to take action on their data faster—right where they get insights. Tableau Actions with Salesforce Flow provides a new dashboard button that authors can configure to initiate pre-created workflows in Salesforce Flow from within Tableau. These flows can drive automations and workflows across any application.
Making analytics easier, more efficient, and more powerful—it’s Devs on Stage
It wouldn’t be a Tableau Conference without the crowd-pleasing Devs on Stage! This year, three incredible developers roused cheers and applause showing off cool new features coming to the Tableau platform.
Solve complex problems with more Tableau magic in your data models
Product Director Nathan Mannheimer kicked off the Devs on Stage demos with capabilities in Tableau’s data model that enable faster and deeper analysis with virtually any data.
Shared Dimensions allow for more sophisticated data models in Tableau that may have previously required creating multiple data models or writing complex, analytical SQL. This means you can relate multiple fact tables across multiple shared dimensions in Tableau to handle more complex data models.
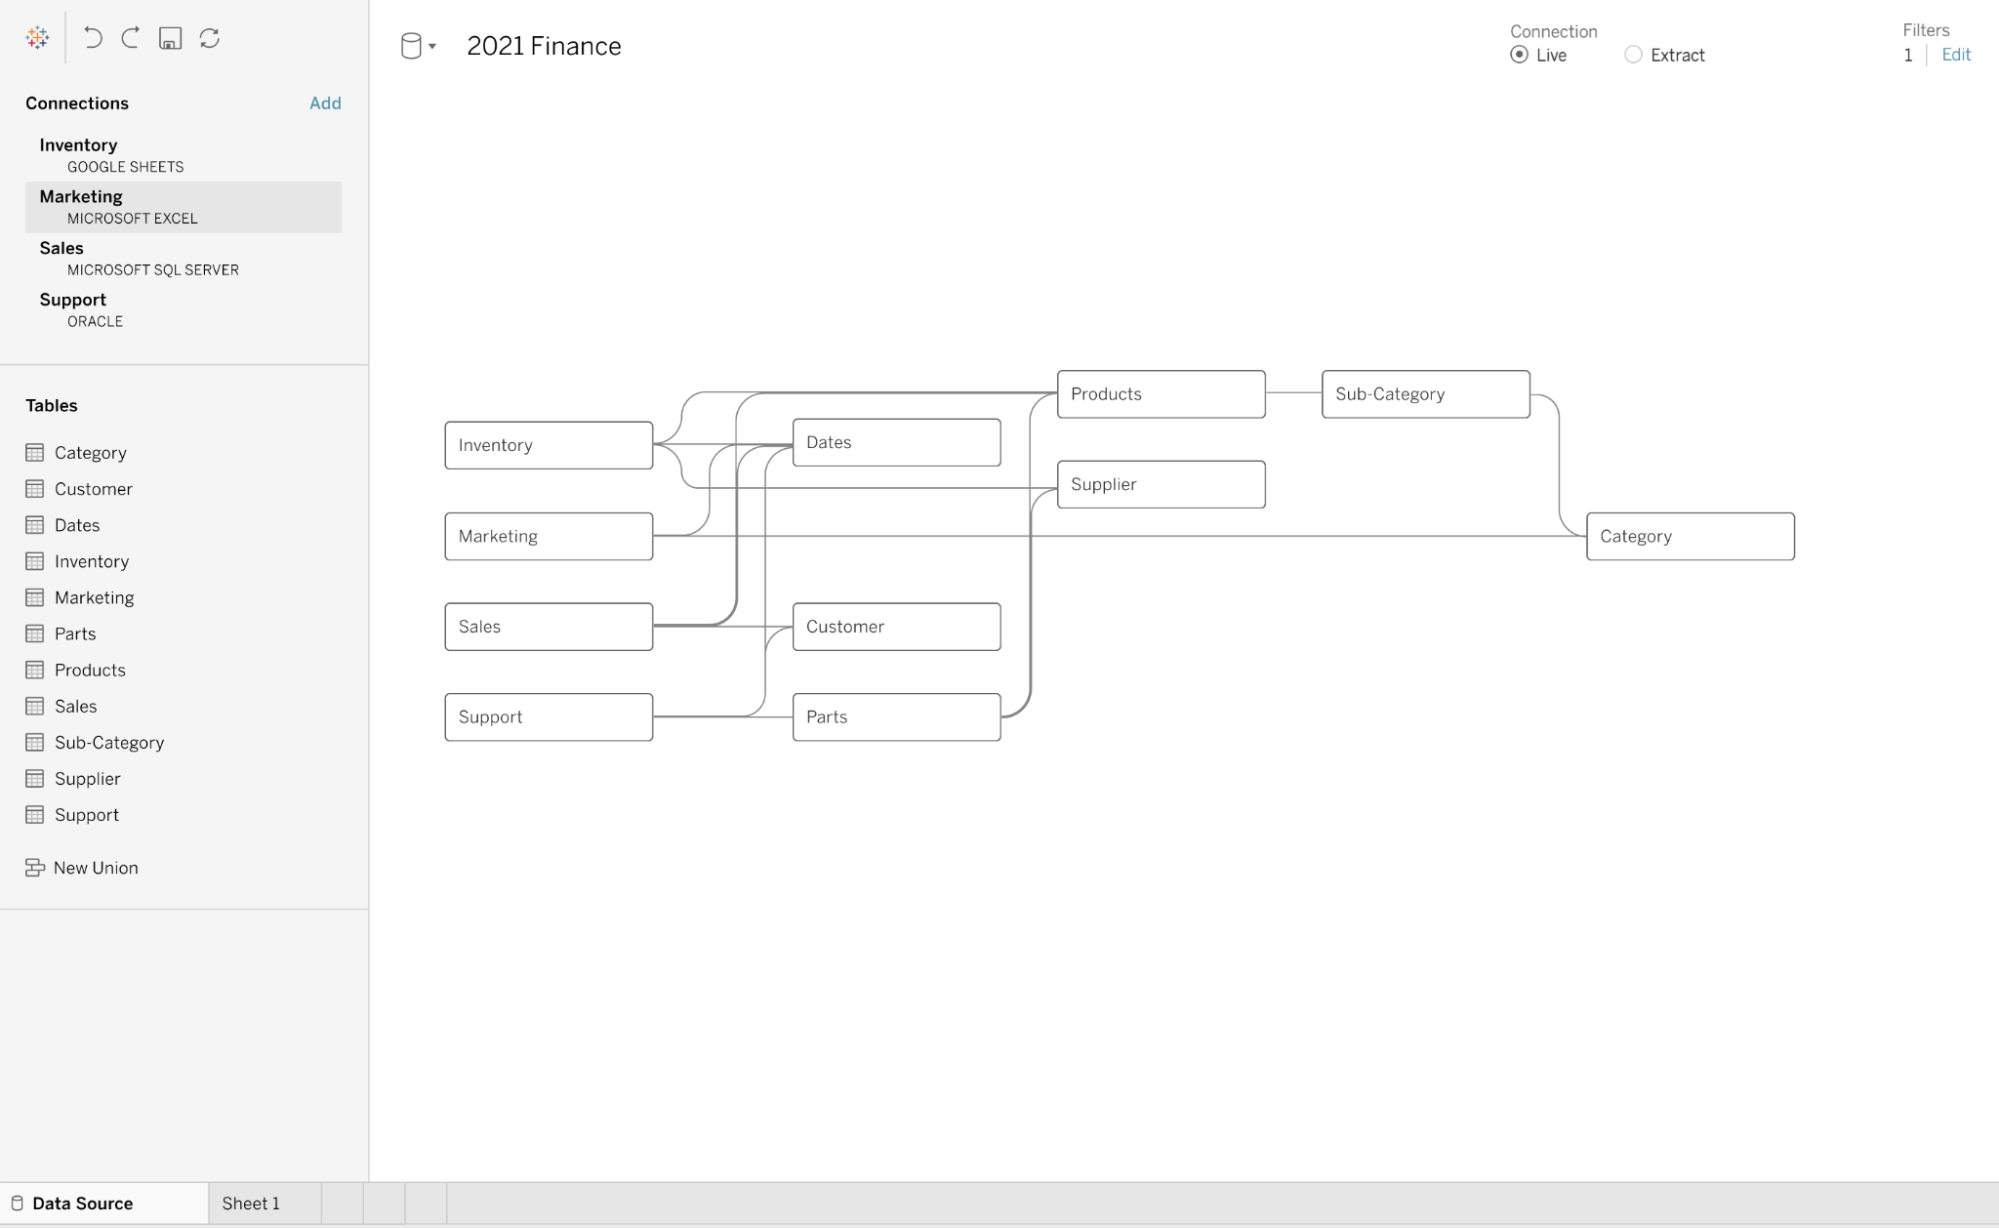
Tableau's data model can now support complex relationships between multiple fact tables with shared dimensions, like you might see in SAP or Salesforce.
Web Data Connector 3.0 has been redesigned to make it drag-and-drop easy to connect to any web data and APIs—no need to set up an external server. Web Data Connector will be available in the Tableau Exchange and available directly to use in Tableau.
Table Extensions bring the power of analytical tools like R and Python right into the core of Tableau’s data model. Nathan used a custom script to transform and analyze tweets about TC22 and bring back a dataframe to analyze in Tableau.
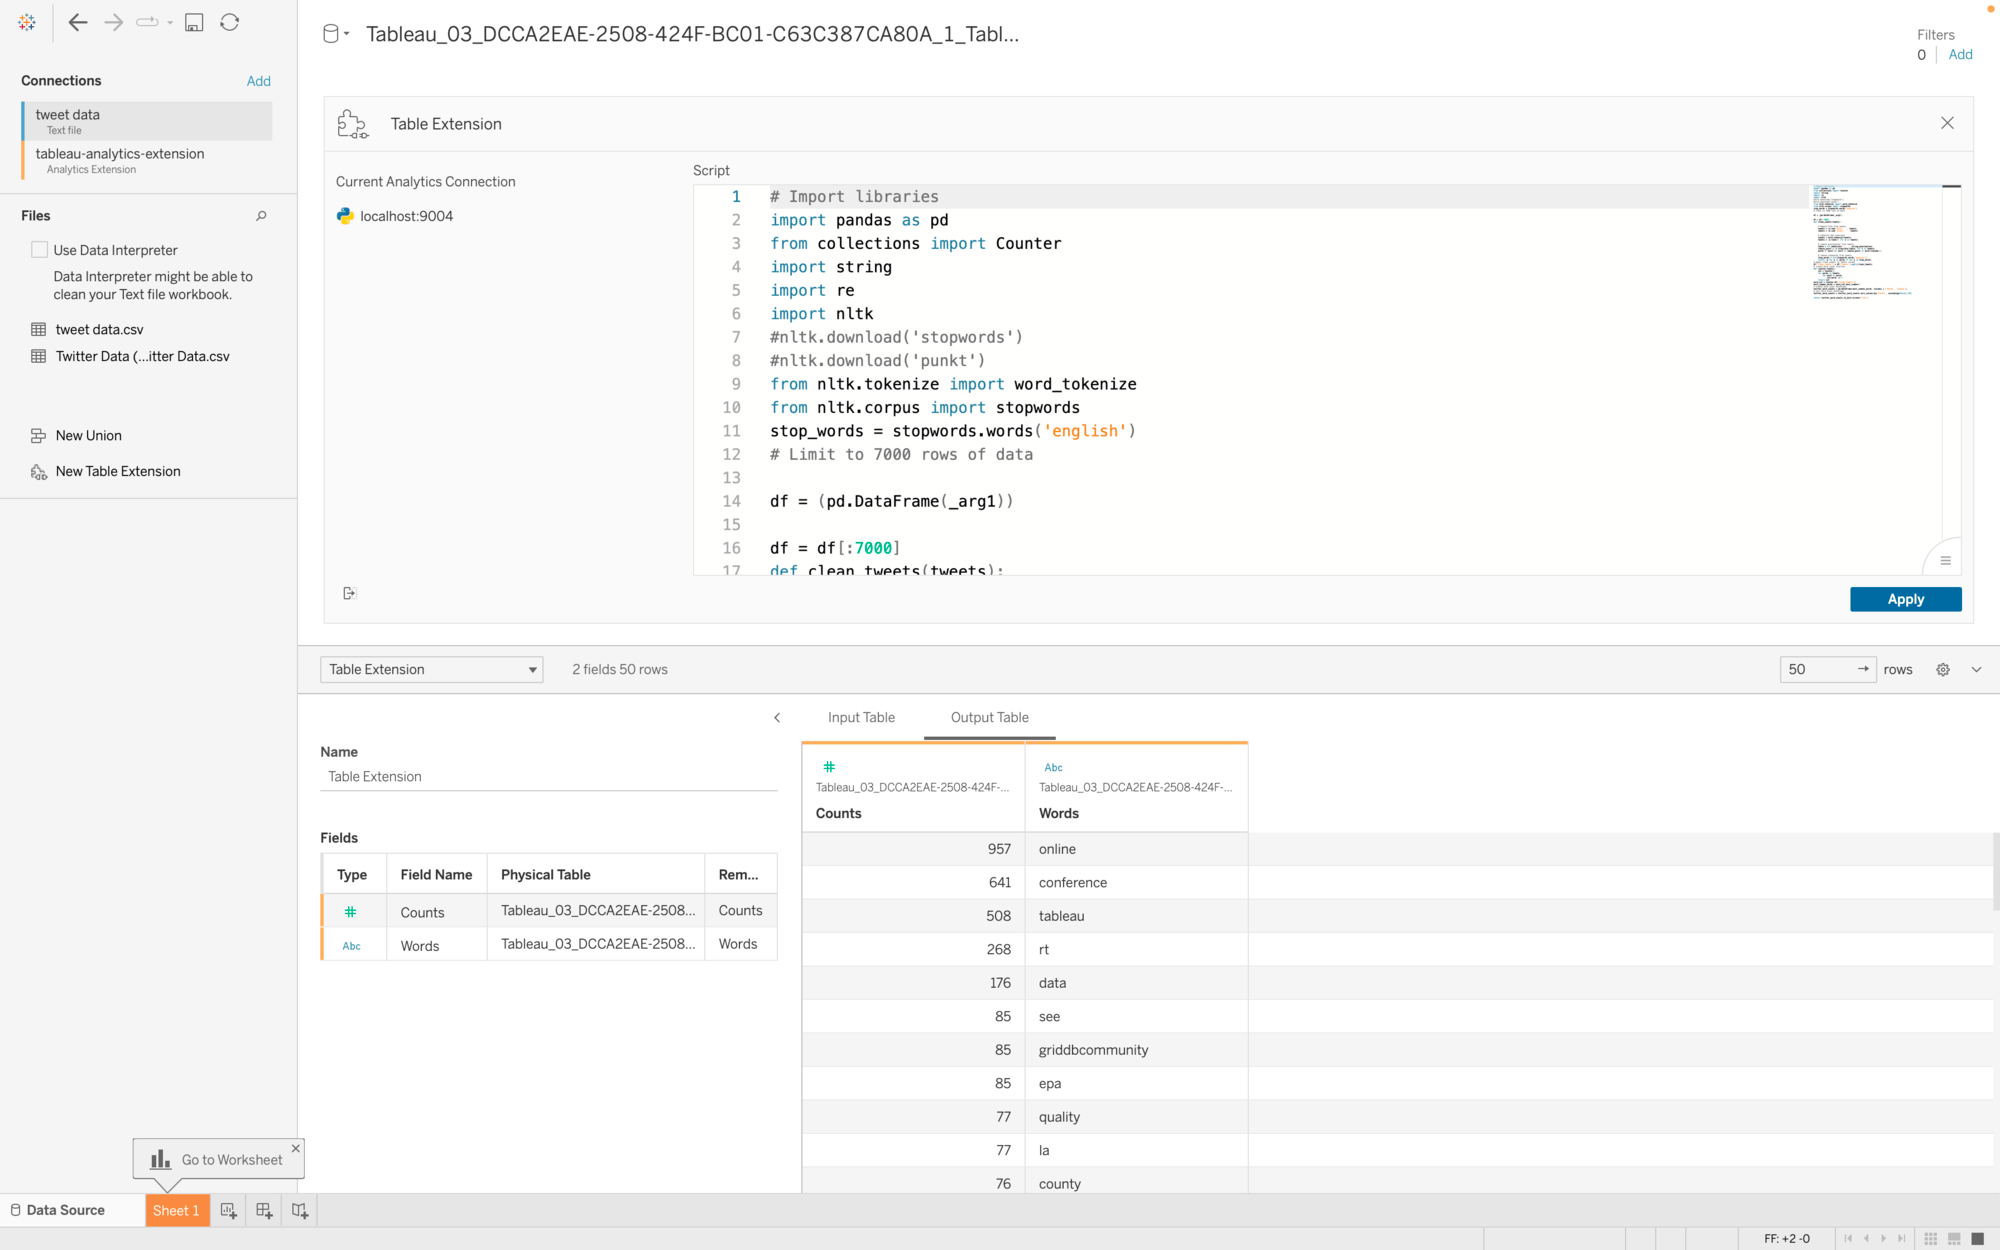
Nathan used a custom script to transform and analyze tweets about TC22 and bring back a dataframe to analyze in Tableau.
Get answers from your data faster with enhancements to Tableau Prep and Ask Data
VP of Product Development Samantha Kwok showed us how new features in Tableau Prep will help you clean your data faster and make it easier to analyze data over time—all without leaving your flow.
Add a row ID column in Tableau Prep in just a few clicks to retain the order of your records—no more leaving Prep to add a new column with the row number.
Clean null values in Tableau Prep and fill them with the previous value. For example, you can easily replace nulls for records that share the same date, like sales transactions.
Sam demonstrated how easy it is to add a column with each record's row ID, and then quickly replace null values with the previous value's date. Each operation takes just a few clicks in Tableau Prep.
Multi-row calculations in Tableau Prep enable you to use moving calculations, like running totals or a moving average of sales. This offers a faster, more efficient alternative to creating table calculations, which can be difficult to define and may slow down your workbooks.
Sam showed us how to create and configure a moving calculation as a new field—directly in Tableau Prep, with visual feedback.
With her data prepped, Sam built a dashboard with an Ask Data zone to demonstrate how users who are less familiar with the data can get insights using our enhanced natural language interface.
Ask Data Phrase Builder, released in Tableau 2022.1, offers a guided workflow with visual prompts to help people navigate the data—including suggested actions like recommending filters.
Ask Data phrase recommendations, coming later this year, use machine learning to interpret intent and make additional, intelligent suggestions. With more options and flexibility to explore the data source, phrase recommendations will help users hone their analytical questions and discover insights.
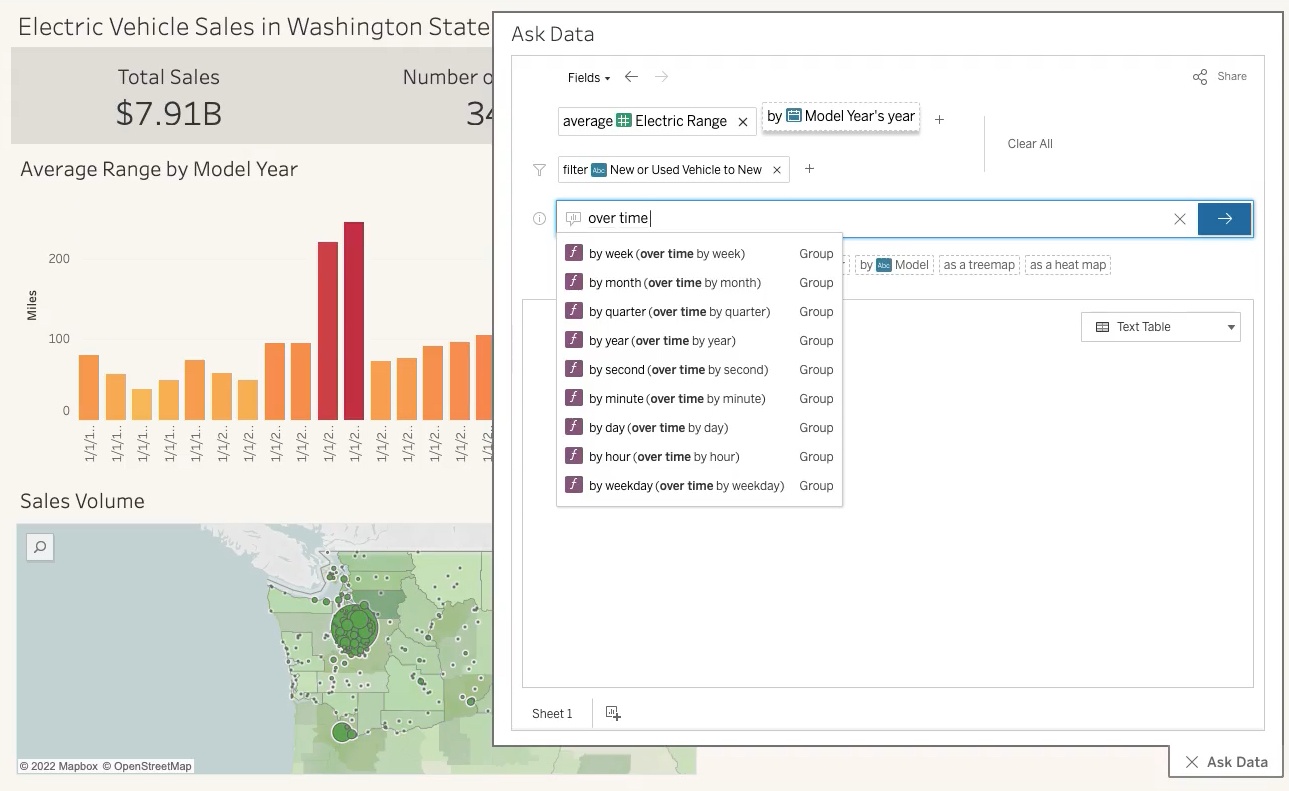
Ask Data uses AI to interpret user intent and make intelligent suggestions for additional ways to explore data—like recommending that Sam look at electric vehicle range broken down by make.
Add rich information and images to dashboards with greater efficiency
Senior Software Engineer Jon Wong-Lam closed the show with two features that help people see and understand their data through richer experiences.
Data Orientation Pane offers helpful information and resources right within a dashboard, including descriptions, a list of data sources and fields, a summary of how the data is filtered, and even links to external resources. Plus, the Data Orientation Pane dynamically updates all this information when a user selects a specific viz or a mark.
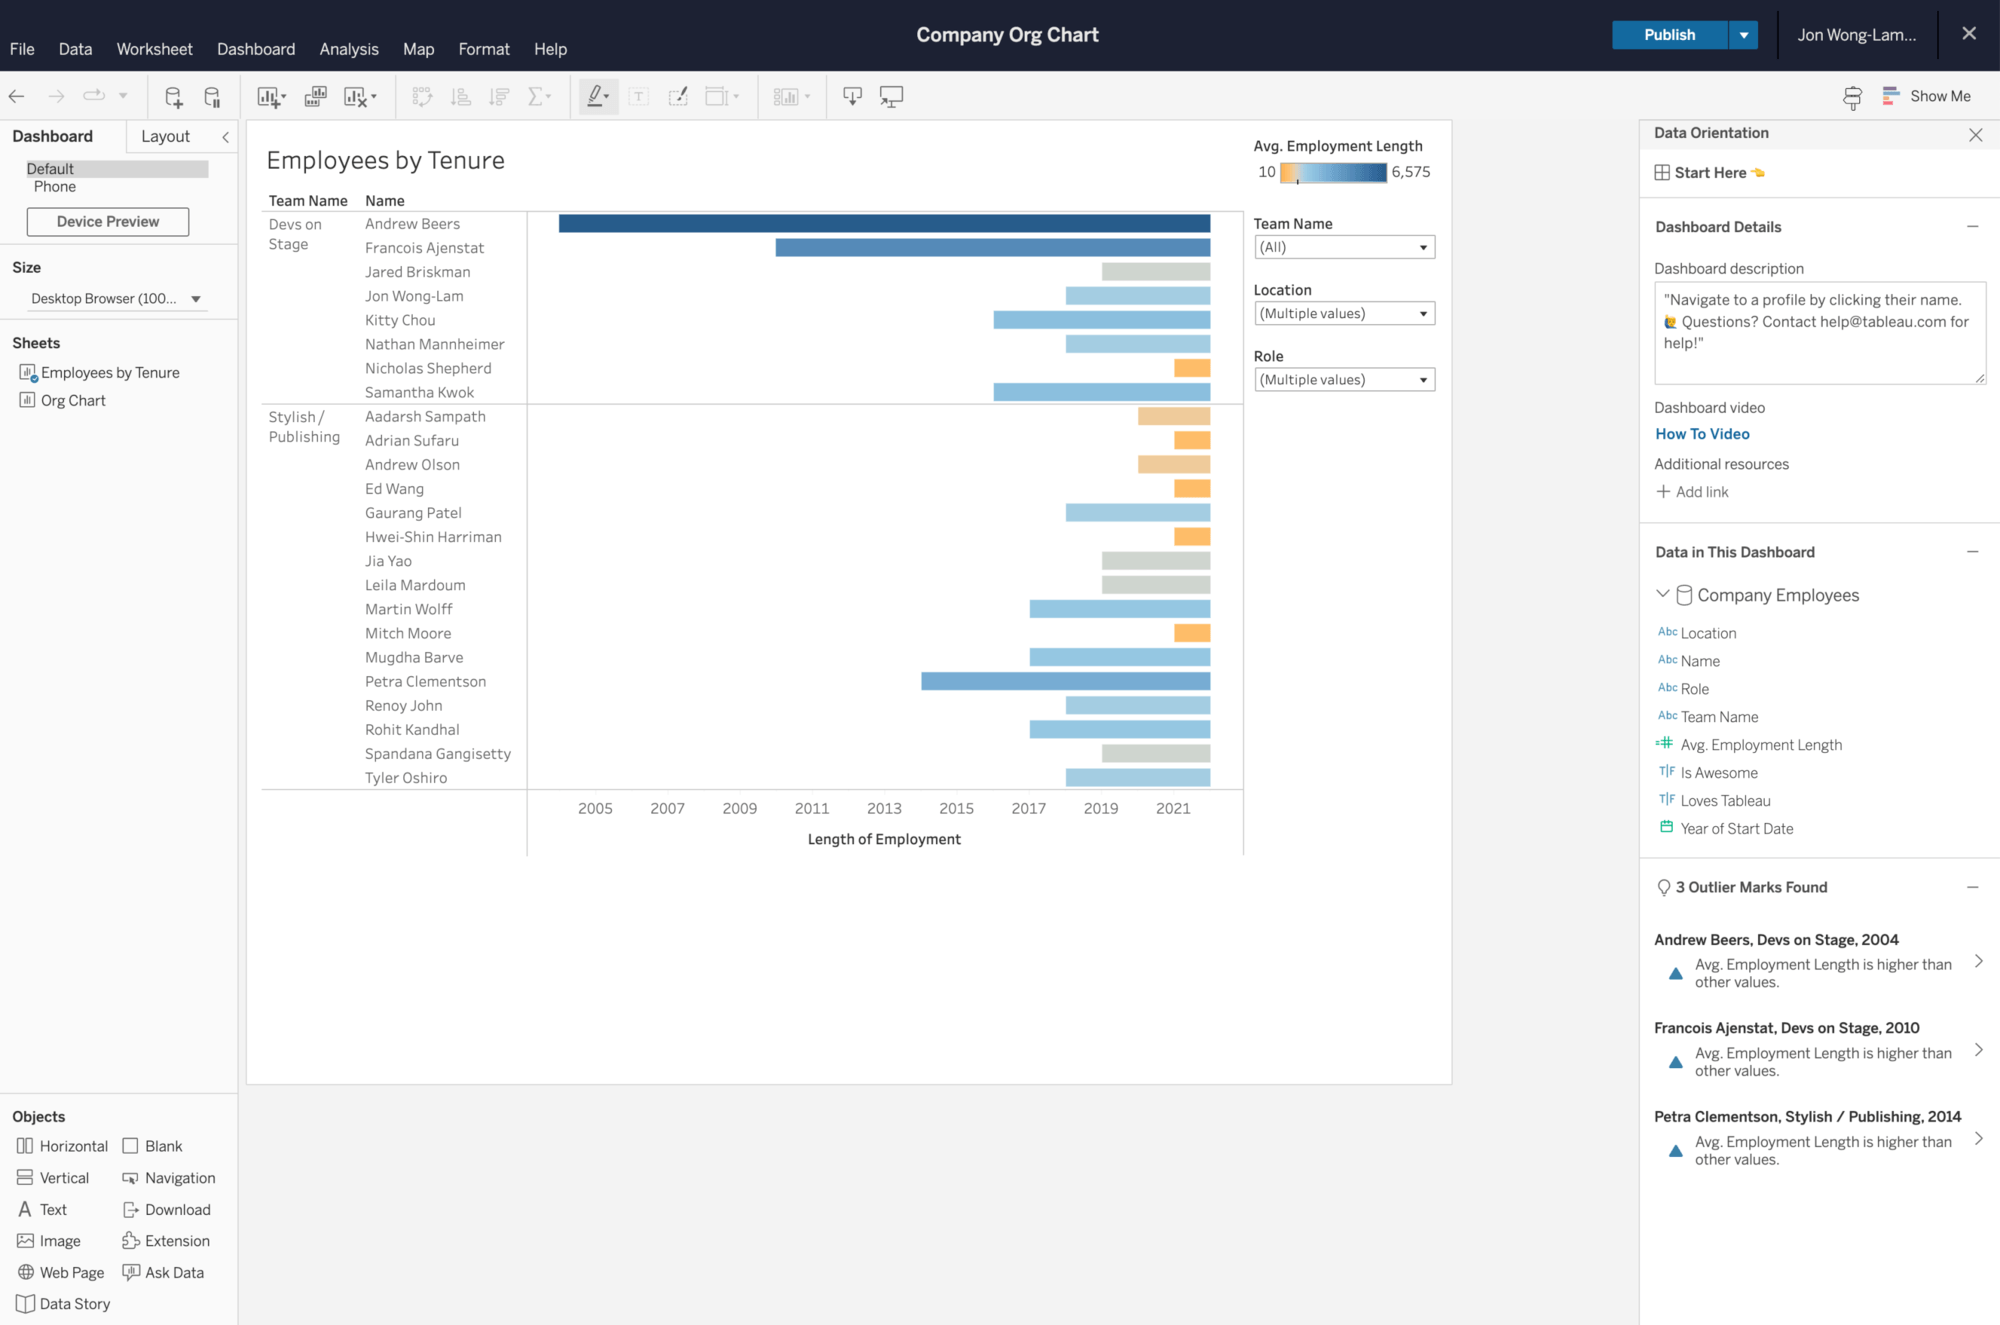
With the Data Orientation Pane, Jon can communicate helpful information about the dashboard with any viewers, including an external link to view a how-to video that helps onboard new users.
Image Role introduces an efficient way to add dynamically rendered images in bulk to your Tableau content using a field with image URLs.
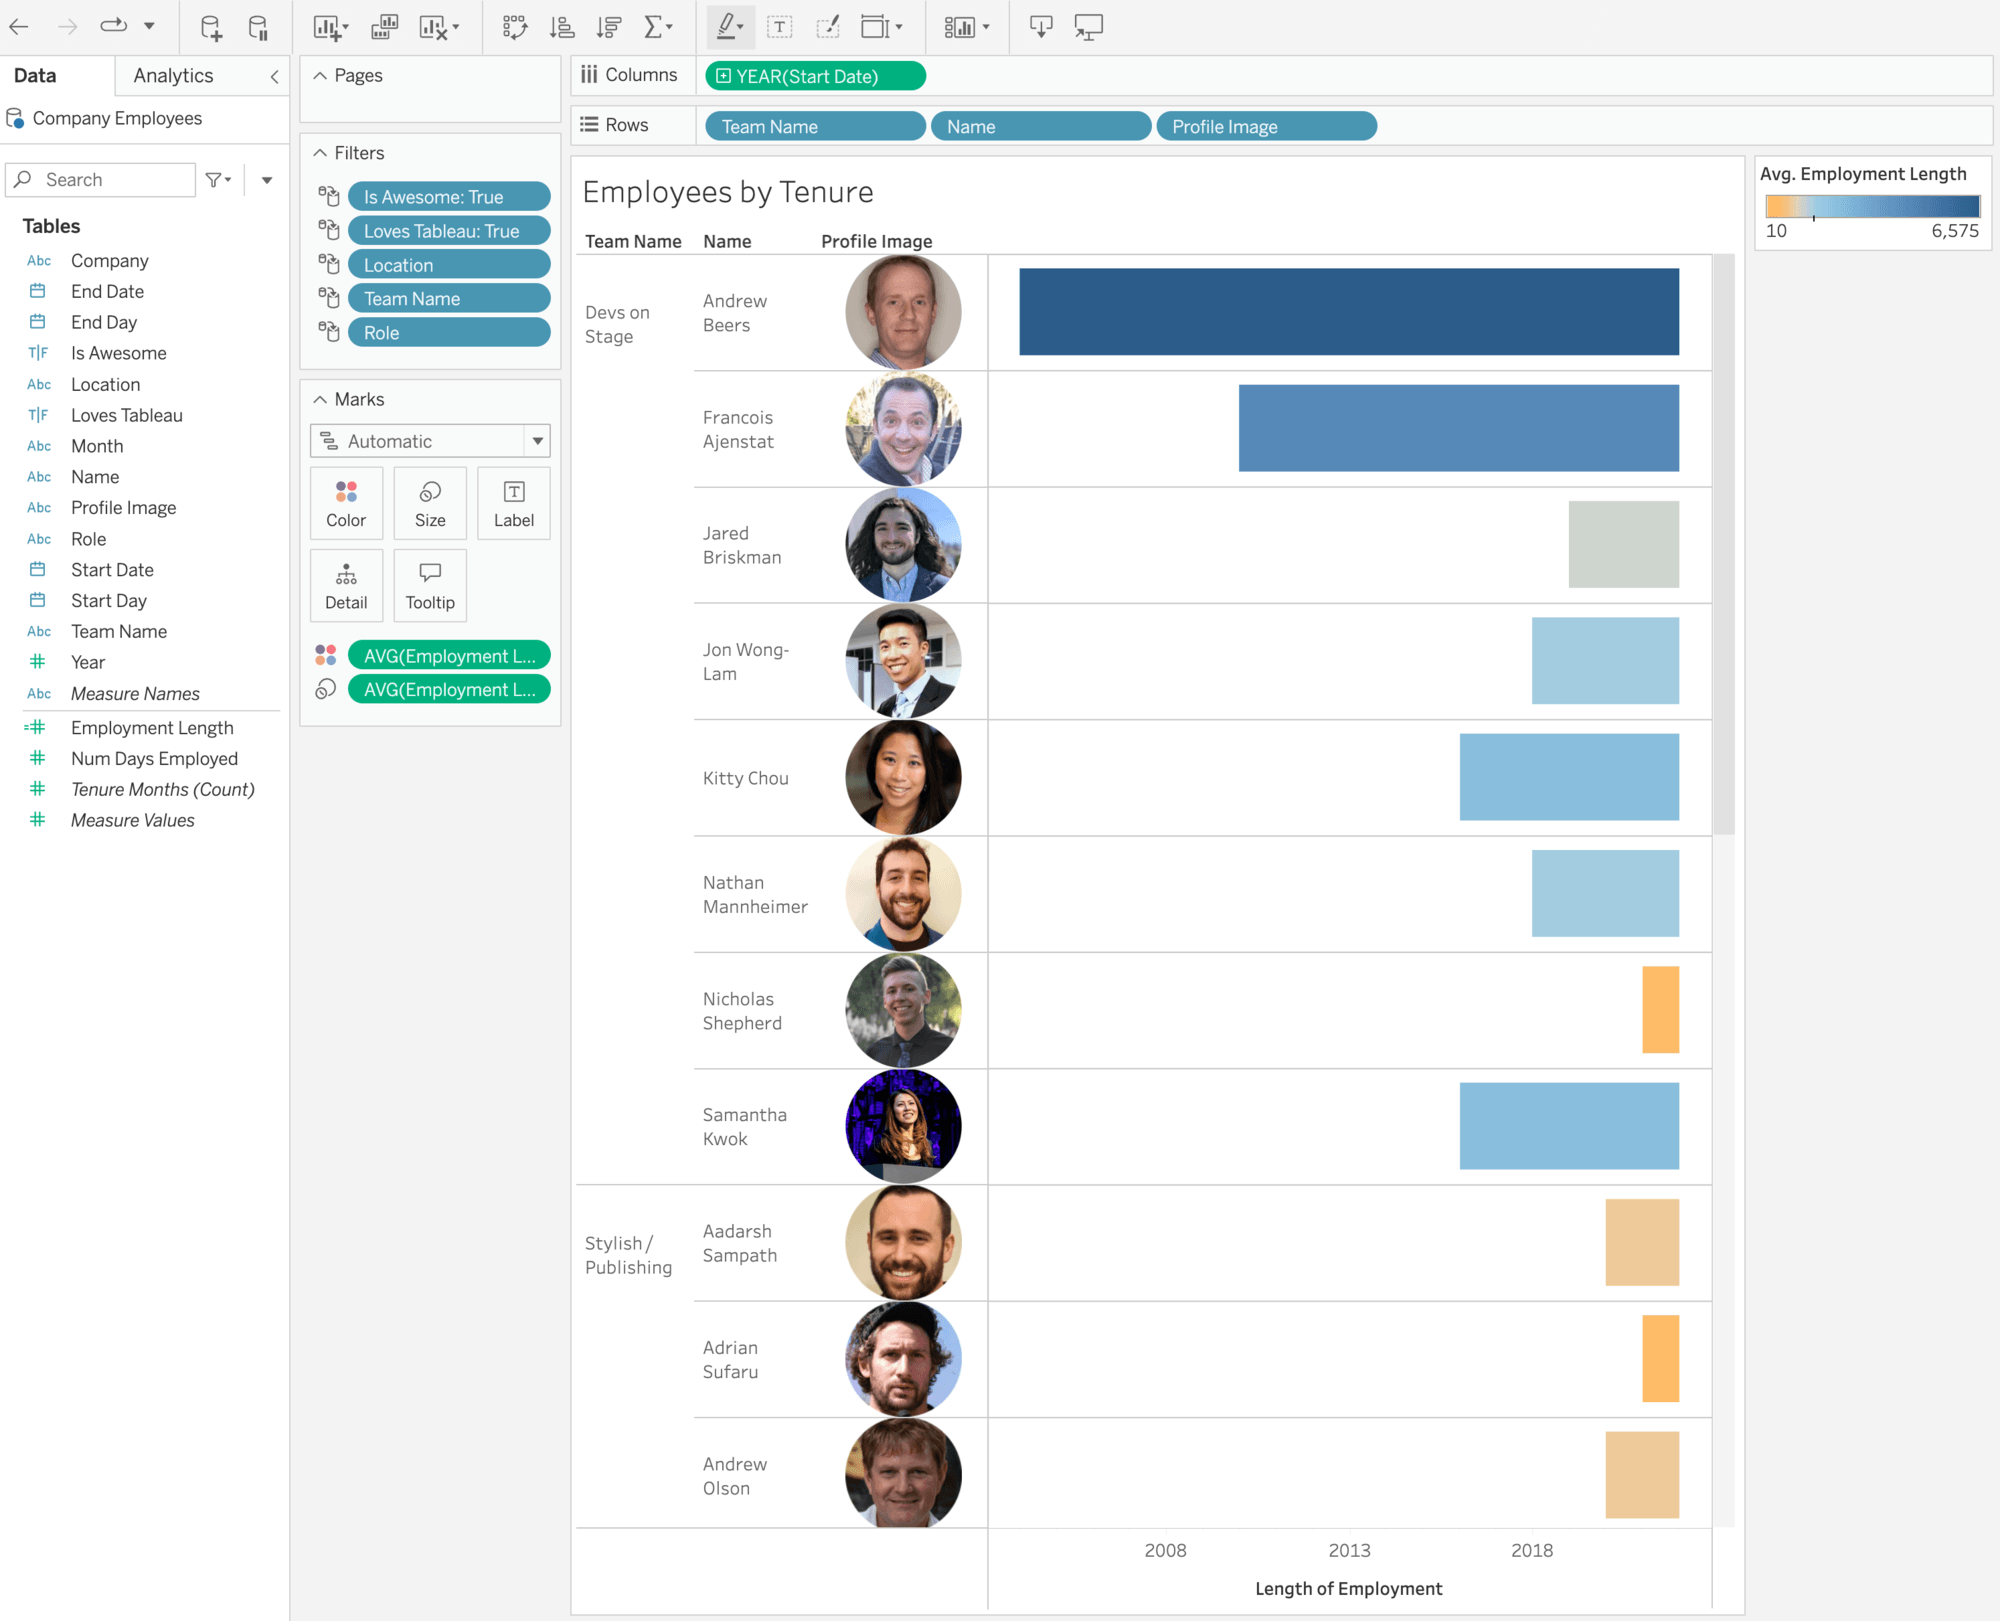
Dragging and dropping a field with image URLs, Jon was able to add employees' headshots to his viz about tenure at Tableau.
Want to learn more?
If you missed the TC22 opening keynote and you’d like to see these exciting product capabilities in action, be sure to watch it on demand.
Explore recent product releases, or submit an idea to let us know what you’d like to see next in Tableau!
Finally, we want to thank our amazing Tableau Community for your unending passion, creativity, and feedback as we continue to innovate across Tableau platform. We can’t do this without you—and we can’t wait to see your creativity when you get your hands on all these great new features.
Related Stories

Securely Access and Analyze All of Your Data with Data Connect for Tableau Cloud

Should I Move My Analytics to Tableau Cloud?
 January 30, 2024

Tableau Bridge: A Guide to Seamless Data Connectivity with Tableau Cloud
Subscribe to our blog
Get the latest Tableau updates in your inbox.