3 innovative product sessions you can’t miss at TC


As we head into Tableau Conference season, we’re especially excited about our 2019.3 release, which features some of our most innovative products yet. These additions to our Tableau platform will empower you to discover hidden insights and have greater visibility and control over your data than ever before.
While 2019.3 is available now—and we certainly encourage everyone to start learning and using the products—there is no substitute for the in-person opportunities you’ll see at TC19. We’ll host several sessions with Tableau product and engineering leads, for all levels, on how to best use and optimize 2019.3.
Read on to learn more about AI-powered insights that automatically surface with Explain Data, Tableau Catalog’s organizing and governance powers, and Tableau Server Management Add-on’s ability to help you better manage large amounts of data, even in the Cloud.
In addition to an insider’s look at our latest innovations at TC, you’ll want to see how Tableau masters put our product to the test with Iron Viz, the ultimate data visualization contest. Three Tableau rockstars will compete onstage to build the best viz and become our 2019 Iron Viz Champion.
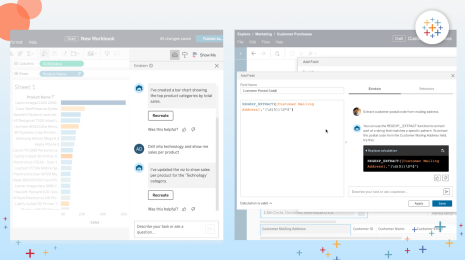
Explain Data
What it does: AI-powered Explain Data helps you better explore and deeply understand your data. Using Bayesian methods, it automatically generates statistically significant explanations for unexpected values in your data with a single click. You simply request an explanation from the context menu or analysis menu, or use the new icon in the tooltip, and Explain Data will surface the possible explanations in a viz that can be added to a workbook for further editing or sharing. This not only saves you time, but helps you find potential outliers buried in your data.
Can’t-miss TC session: “Leveraging Explain Data”
For advanced analysts, you will learn more about how to add Explain Data to your toolkit to take your data analysis to next-level amazing. When you have Explain Data automatically working behind the scenes, finding and surfacing data points you need to know about, you’ll wonder how you ever lived without it. This session will also show you some practical ways to leverage Explain Data and best practices for deployment.
Session speaker William Watkins, product consultant:
"What excites me most about Explain Data is how it will enable analysts to explore an entire dataset with a simple click. We no longer need to drag and drop every field to find outliers and intriguing relationships. […] I am honestly most excited to make people aware of this amazing feature and get it into their hands."
Tableau Catalog
What it does: Tableau Catalog gives IT and business users a complete view of what’s being used in Tableau, helping everyone find what they need while building trust in the data. Data owners can automatically track information, including usage metrics, lineage, and impact analysis. It also includes data quality warnings that let users know when there are issues like missing fields or maintenance interruptions, ensuring more visibility, confidence, and an optimal user experience.
Can’t-miss TC Session: “Data Catalog Introduction and Overview”
Get a walkthrough of how Tableau Catalog works, main use cases, and see some of the roadmap features in this introductory keynote to the product. You’ll quickly see how Tableau Catalog automatically ingests all the data in your Tableau environment into one central list so you can automatically see your tables, files, and databases in one convenient place.
Session speaker Kate Grinevskaja, product manager:
"Not having a catalog on data-related projects can be a disaster. Some catalogs can make the life of technical users and data stewards easier. Tableau Catalog is great for all your Tableau users! With data quality warnings, certification, and data details features, users will have more trust in their data."
Tableau Server Management Add-on
What it does: To improve the reliability and scalability of your deployments, we’re tapping into the power of cloud services. Tableau Server Management Add-on is a broad set of capabilities focused on simplifying deployments of Tableau at scale.
Enhanced monitoring capabilities help to better manage and tune the performance of your server with increased visibility into background processes, workbook performance, and more. You can also streamline your content workflows, programmatically managing the movement of content between dev and production, or between server environments—no scripting needed. You are also able to bring your own security keys with support for Key Management Stores.
For large deployments hosted on AWS, customers can choose to host their metadata repository externally, starting with Amazon RDS Postgres. This approach provides increased scalability and high availability for organizations with large amounts of Tableau metadata.
Can’t-miss TC Session: “Enhance Your Enterprise Capabilities with the Tableau Server Management Add-on”
As organizations expand self-service analytics, it becomes increasingly challenging to scale and manage those deployments in a secure, governed, and trusted environment. In this session, you will learn more about how to improve the manageability of Tableau Server clusters with workload management and enhanced monitoring, simplified content migration, and advanced encryption key management.
Session speaker Hemanth Srinivas, director, engineering:
"I’m biased, but I am most excited about the Server Management Add-on. I think it provides customers greater insight into their Tableau Server usage, increased content mobility, and finer grain control over how best to utilize their resources."
See Tableau in action with ‘Iron Viz’

It’s our Super Bowl or Masters tournament of data. Three Tableau masters face off in an epic battle of who can make the best, the brightest, the most mind-blowing viz possible. Wielding matching datasets and Tableau Desktop, these finalists will fight to the finish to make the finest visualization in the arena at TC.
This year, there were almost 300 people from around the globe all vying for the right to become the next Iron Viz champion. We’re excited to reveal this year’s finalists who will take to the Vegas stage: Joshua Smith from Columbus, Ohio, Lindsey Poulter from New York City, and Hesham Eissa from London.
Who will become our next Iron Viz Champion? You’ll have to catch the live show at TC to find out.
See you at TC19!
At TC, you’ll get the chance to choose from nearly 400 sessions(!) on how to optimize Tableau. Dive into the TC19 Session Catalog to discover the various breakouts, meetups, etc. relevant to your role, industry, and skill level. Tableau people will be on hand to present, answer questions, share insights, and help you get the most out of your experience. You also get the added benefit of tapping into the power of our Tableau Community, enthusiastic, smart people like you who love to share tips. There is simply no better opportunity to up your data skills with Tableau than TC.
Get your Tableau Conference ticket now to join the largest data community in Las Vegas, November 12-15.
Related Stories
Who is Einstein Copilot for Tableau for?
 April 10, 2024

Securely Access and Analyze All of Your Data with Data Connect for Tableau Cloud
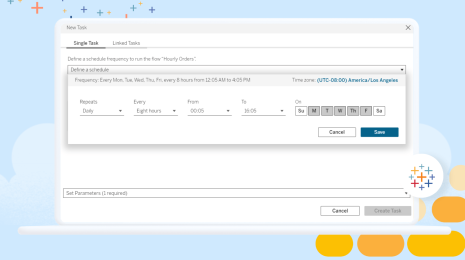
Tableau Prep Conductor Supports Custom Schedules
 March 15, 2024
Subscribe to our blog
Get the latest Tableau updates in your inbox.