Generation Data: How data visualisation inspired this student to go back to school


Editor’s Note: This piece is part of the Generation Data series on the Tableau blog. At Tableau, we feel that data skills are essential for the next generation of professionals and business leaders. The Tableau Academic Program seeks to arm students with the valuable analytical skills needed to think strategically and make an impact, both academically and professionally. If you are a student, download your free Tableau license today to start learning data skills.
Melody Cheung with the Academic Programs team at Tableau sat down with Leon Lok to talk about his experience with Tableau and how it inspired him to go back to university.
A current masters student at the University of Leeds, Leon Lok — a self-professed Tableau Geek—first used Tableau as a business analyst after completing his bachelor's degree in mathematics. With no prior exposure to data visualization or Tableau, Leon quickly learned the power of data by visualizing dashboards for day-to-day reporting. Now back at university for his master's degree, Leon shares what he’s learned, and the role data has played in his decision to go back to university.
Melody Cheung (MC): Can you share a little about yourself?
Leon Lok (LL): I graduated from the University of Leeds in 2016 with a BSc in Maths with no exposure to data visualisation or Tableau at all. Then I got my first job in data as a Business Intelligence Analyst. And now I'm a student at Leeds again, studying for my Masters in Data Science.
MC: You just couldn't get away from university! Did you use Tableau in your bachelor's degree?
LL: No, I didn't even know Tableau existed until I started my BI job!
MC: Can you tell me a bit about how you got started with Tableau?
LL: After graduating, I started work, and a big part of my job was to create interactive dashboards for company directors using Tableau. They would play around with these dashboards for day-to-day reporting and made decisions based on them.
MC: What was your first impression of Tableau? Did you find it easy to learn from scratch?
LL: [Laughs] If I'm honest, I actually wasn't that bothered by Tableau at first. I was taught the basics from my colleagues, but Tableau wasn’t used that much or by many people. Once I started getting more into it and discovered some of the functionality, I became really interested. Even more so once I found Tableau Public and the Viz of the Day.
MC: Yes! You could easily spend hours scrolling through. Did you use the training resources on the Tableau website?
LL: A lot of what I learned was actually through trial and error. Finding vizzes on Public and taking them apart helped me to learn how they were made. I also used Tableau almost every day. I'd say I spent 50% of my time on Tableau with dashboards and visualizations, then most of the remaining time on reporting, so having that level of exposure for it was important. I ended up using Tableau so much that most people would come to me for help. They knew I was the guy that would spend hours trying to add even the smallest details to make a dashboard look and feel better, so it sort of became an inside joke.
MC: So why did you decide to go back to university, and why Data Science?
LL: I wanted to learn data science not just from a visualisation and reporting perspective, but also from a back-end data management and preparation perspective. A lot of data science is about presenting findings, but I believe that this is only possible if data is collected and prepared correctly in the first place, so I wanted to learn more of that by going back to university. I also wanted to learn more about machine learning and AI, given how incredibly useful they are for automating certain processes which I could have benefitted from in my last job as a BI analyst.
MC: How does data visualization play into your university life?
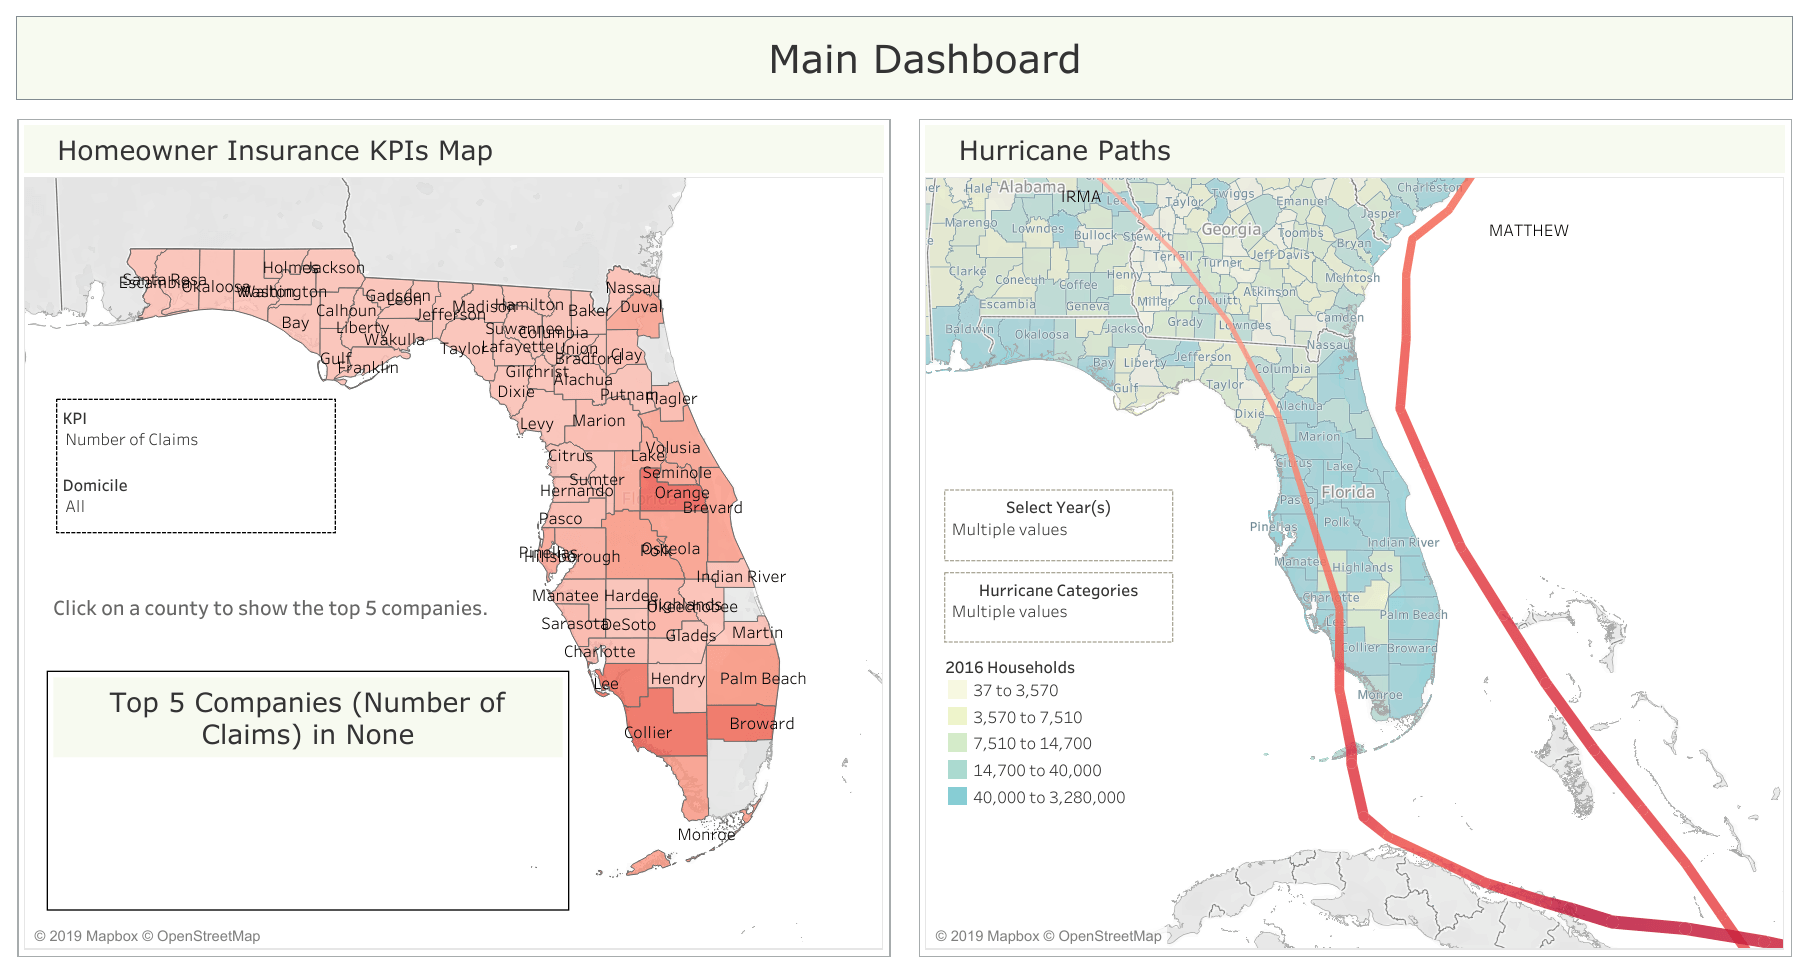
LL: I have used Tableau in almost every data science project that I’ve worked on at university, and now I wish I knew Tableau when I was doing my bachelor’s! For example, I did a small case study on climate change, and part of that was about the increase in frequency and intensity of hurricanes. Tableau allowed me to create maps of hurricanes like what I did for the Hiscox Challenge, which I wouldn’t have been able to do otherwise. Creating simple plots in Tableau was also very quick and easy, so I could spend more time on writing the report rather than trying to get a piece of code to work properly.
MC: Could you tell me a little about the Hiscox Challenge?
LL: We had to look at creating KPIs for selecting the best companies to reinsure in Florida. Since Florida gets hit by a lot of hurricanes each year, we decided to use them as our main approach. We got some data on insurance companies in Florida, and we found and cleaned the hurricane data ourselves. Part of the assessment was to see whether the companies we predicted matched with what was actually in their portfolio of companies using our own KPIs that we created. We never knew who they actually reinsured. So we used Tableau to create an interactive dashboard showing the KPIs we created for each county within Florida. You can click on a county to see the top companies within that county according to the selected KPI. Also, the dashboard shows all the hurricane paths since 1851 as well as their intensity (wind speed) during their lifetime. This was so Hiscox could see the general pattern of hurricanes in that region, so they could use that information together with the KPIs that we created. Our KPIs were to look at these companies and pick the best ones to target.

MC: What is your recommendation for students trying to get to grips with Tableau for the first time?
LL: The best way for new users to get to grips with Tableau is by finding a small and straightforward dataset to create some simple dashboards. There's also plenty of great dashboards on Tableau Public that you can download and learn from for free.
MC: What is the one thing that all students should learn how to do in Tableau?
LL: I think students should definitely learn about data connections, data types, and table joins in Tableau's "Data Source" interface. There were some occasions where I've seen new users struggle to get anything to work because they couldn't set up the data correctly in the first place! Luckily, Tableau has made it quite easy for the user to see what is happening with the data.
MC: What is your favourite viz type?
LL: I've recently seen some visualisations created for the Iron Viz challenge, and I love how creative the entries are and how they tell a story as you scroll down the dashboard. One that stood out to me was about Agriculture in the United States. I really like how clear the data is presented, and it also gives the viewer suggestions on what can be done to improve at the end.
Join the students of Generation Data and download your free Tableau for Students license today to start learning data skills.
Related Stories
Data Literacy for All: Free data skills training for individuals and organizations
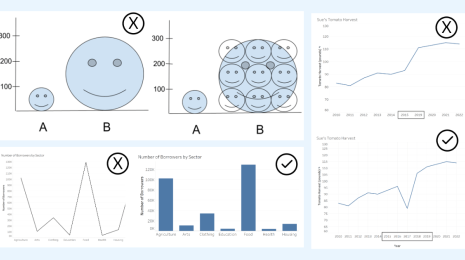
How to Spot Misleading Charts, a Checklist
 November 15, 2023
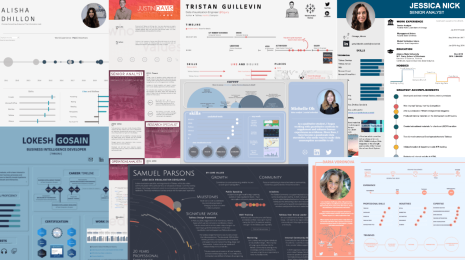
Stand Out in Your Job Search with an Interactive Tableau Resume
 December 8, 2022
Recruiters spend just 6 seconds skimming through each resume. Show off your data visualization skills and stand out in the application process by visualizing and making it interactive in Tableau.
Subscribe to our blog
Get the latest Tableau updates in your inbox.