How I used Tableau to unearth hidden stories about Dream Teams


Update: Elissa Fink is going live with Shane Snow to talk about his book, Dream Teams. Join our livestream on June 14 at 11:15AM on Facebook or YouTube to hear how data played a role in his latest book.
Editor’s Note: This guest post comes from Shane Snow, founder of content technology company Contently. Snow's writing has appeared in Fast Company, Wired, and The New Yorker.
For several years now, I’ve been obsessing over various paradoxes about humanity. Why do we say that groups of people can add up to more than the sum of their parts, and yet almost all groups get slower the bigger they get? Why do more than half of company mergers — and marriages for that matter — fail, when they start out with so much promise? Why is it that humans are uniquely built to collaborate and create amazing things, and yet are one of the only species that destroys its own kind on a frequent basis?
This obsession turned into a series of adventures through history and science, which in turn became Dream Teams, my new book via Penguin Random House. It’s about becoming incredible together, and working together without falling apart. (And it’s also about rappers and pirates and a whole bunch of other fun topics. Learn more about it here.)
I documented the painstaking process of putting Dream Teams together in a longer post here, but I wanted to take some time in this post to dig into a specific thing that helped make this book great: Using Tableau to dig through data to unearth stories and counter-intuitive insights about teamwork.
As a reporter and storyteller with a bit of a nerdy side, I am pretty good at a lot of computery things. But I am not a data scientist. I have to look up spreadsheet formulas every time I use them. I know that data is usually plural and not singular; and that data sometimes live in a base. (I imagine it’s a fun place where they all hang out and wear Yankees jerseys.) But I know that because I work with words, not with servers.
But Tableau helps me, basically, be a data scientist without having to actually be one. And that’s been fundamental to my journalistic success. Here’s a bit about how I used the Tableau in the making of Dream Teams:
In middle school, one of the few things I liked more than the math club was the science fair. If you ever did science fair, you may remember the Scientific Method, as taught to school kids. This is basically what I think all writers should keep in mind when embarking on research for their books.
Step 1: Make an observation
Step 2: Form a question
Step 3: Form a hypothesis
Step 4: Experiment/research/interview/etc. to disprove or prove the hypothesis
Step 5: Analyze the results and draw a conclusion
When I go through this process, I’ll typically create an Evernote notebook on the subject and fill it with notes—from interviews, scholarly research, documentaries, books, etc.
Some observations and questions will not be answerable by researching what’s already out there. So I’ll have to either…
- interview people and extract insights from them;
- find raw data and extract insights from it; or
- conduct an original study or experiment.
For Dream Teams, there were three big (and a lot of little) projects for which sifting through data ended up being important:
Project #1: Innovation vs Inclusion
In the course of research, I came across a statistic from Gallup that said workers were more likely to do poorly if their managers ignored them than if their managers mainly focused on their weaknesses. I found this curious, and dug a pretty deep rabbit hole to learn about the damaging effects that exclusion, organizational silence, and superficial communication have on relationships—at work or in life in general.
My observation: Excluding people makes for unstable relationships.
My question: How does exclusion affect companies?
My hypothesis: Excluding people decreases the likelihood of producing breakthrough innovations or novel solutions to problems inside of a company.
My experiment: I decided to do a SurveyMonkey poll of American workers at fast-growing, innovative companies, and pit them against workers at slow-growing, non-innovative companies. SurveyMonkey makes it easy to generate lots of data really quickly. So I designed a survey and collected data on this front.
My analysis: I exported the SurveyMonkey data to CSV, and then loaded the survey responses into Tableau. Tableau immediately spat out this chart for me (which we then re-formatted for the book):
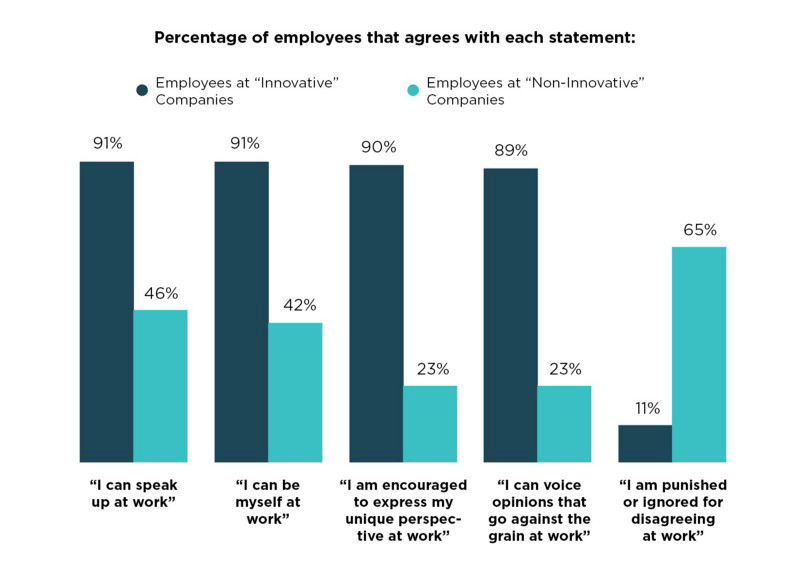
Turned out my hypothesis was correct, and even more so than I imagined. The results, as shown here, are stark: The more you let someone be themselves at work, the more you allow them to participate from their different points of view, the more likely the company will be fast-growing and innovative.
Project #2: Gay Television
Another big, interesting thread I chased in Dream Teams had to do with the struggle for acceptance of gay rights, and how that related to the stories being told in popular media.
My observation: There seemed to be a lot more sympathetic gay characters on TV these days, and also Gallup polls were showing that people were generally more pro-gay rights.
My question: Which came first: Sympathetic gay characters on TV, or gay rights?
My hypothesis: Knowing what I know about the neuroscience of storytelling, I bet that the stories on television had an impact on gay rights before popular opinion did.
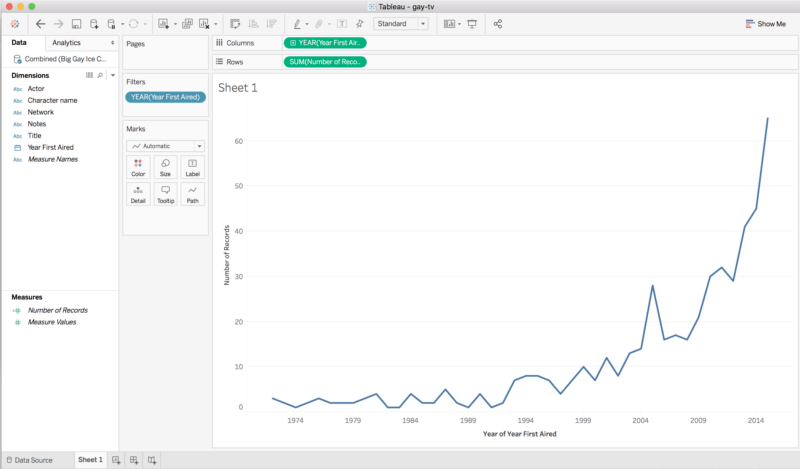
My experiment: I downloaded TV show data from IMDB and made a spreadsheet of all the gay characters on TV from 1970 to the present. In my spreadsheet, I painstakingly indicated whether each character was good or evil (this required a lot of Googling). Once my spreadsheet had all this info in it, I used Tableau to chart the number of gay characters in mainstream fictional television shows per year, as well as the number of good gay characters, etc.
It took me like, three clicks to generate this chart:
I then downloaded a TV script database to chart the usage of gay slurs in TV, and to put the public opinion toward gay people in the 20th and 21st centuries side by side with it and the characters charts. (I got the public opinion data from Gallup.)
All this showed that gay rights and gay TV were highly correlated:
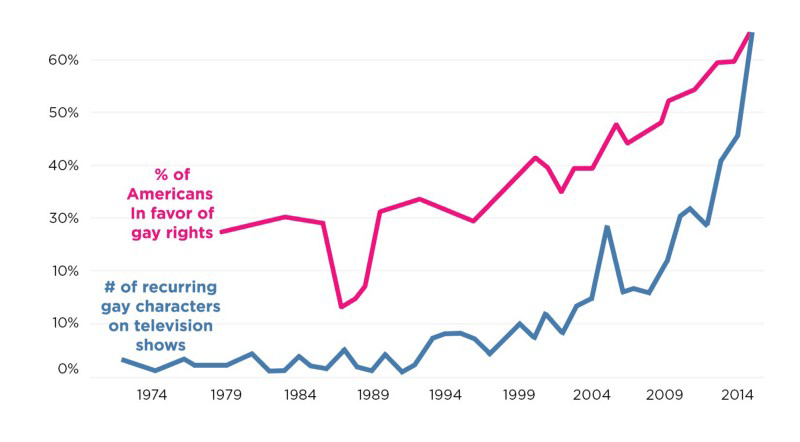
Further research showed that people in surveys actually credit shows like Glee and Modern Family for helping them change their minds about whether their gay neighbors should be allowed to get married. So I now had quantitative and qualitative research showing that my hypothesis was correct. Hooray!
Project #3: Intellectual Humility
This one was a bit more of an involved observation: Our culture talks about open-mindedness as a virtue, and closed-mindedness as the mark of an un-evolved person. But I discovered that philosophers and psychologists have argued for years about what exactly it means — much less, how to measure it.
I then discovered that in recent years, however, scientists had found consensus around a related virtue that embodies what most people mean when they talk about open-mindedness in everyday life.
That virtue is intellectual humility. It turns out that it’s the missing component in the quest to measure open-mindedness — and it’s something that’s key to making our relationships, partnerships, and governments more excellent.
My observation: Intellectual Humility is super important to being a good collaborator.
My question: How do we develop Intellectual Humility, so we can get better?
My hypothesis: Watching news, reading books, traveling, living places, changing your religion or political views—these kinds of things have long been suspected to help us become more open minded. I theorized that was probably true.
My experiment: Nobody had really done a big study using new research that shows how to measure IH, and asked about things like your media habits or where you’d lived. So I conducted such a study on SurveyMonkey:
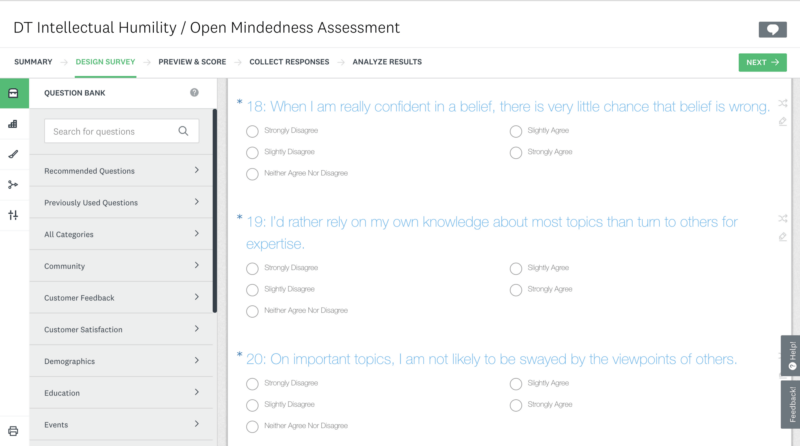
My analysis: I ended up with a giant spreadsheet of answers, which I analyzed using, big surprise, Tableau.
Some super interesting things came out of this study in particular. This chart here is where I looked at data on how much time people have spent living in countries other than where they grew up, and how this relates to different dimensions of open-mindedness, their political leanings, and other attributes:
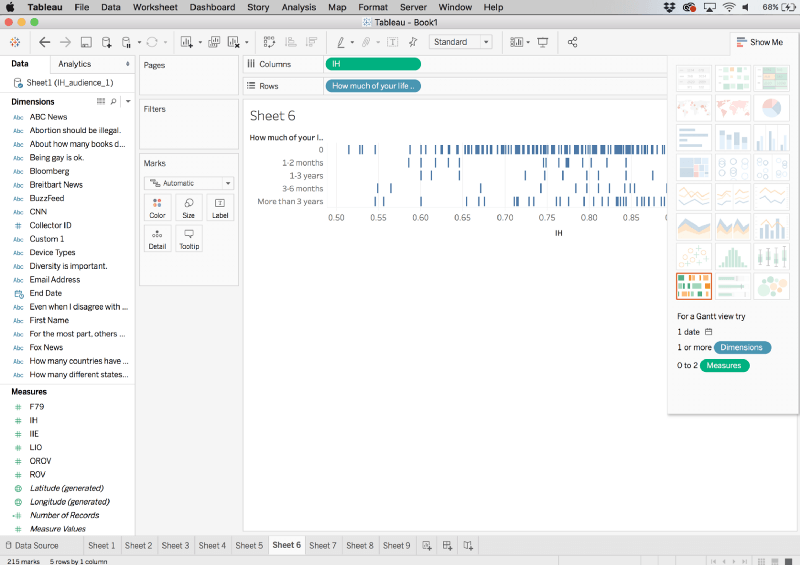
Turns out that traveling to lots of countries is correlated with higher open-mindedness scores. But living in other countries helps even more. So does watching lots of fictional television or reading lots of books! But I was wrong about one thing: taking in lots of news does not increase IH. In fact, even taking in a diversity of news channels (watching both FOX and MSNBC, for example) doesn’t lead to more IH. According to the data, the IH increase only happens with fiction!
Finding stories in data: an easy way to introduce something new to the world in a noisy categories
Some of the best business and pop-science writing in the last decade has been the product of insights from new, original research, entertainingly distilled. I’ve noticed that a lot of it actually deals with categories we’ve been discussing for a long, long time—things like success, money, work, etc. Turns out that data can help us understand things better, even if we’ve talked them to death over the years.
My favorites on this front include Adam Grant’s Give and Take and Originals, or anything by Dan Ariely. These are professors who do rigorous research studies and then find fascinating conclusions inside of the data. FiveThirtyEight, The Upshot, and a lot of what comes out of Vox ends up doing the same sort of thing: introducing new things to audiences by finding stories in data.
And it used to be that you had to have a degree in math or data science to do that sort of thing. But now you can basically just dump an excel spreadsheet of data you’ve collected from a survey or a database you download from the Internet into solutions like Tableau, and the robots will build you charts automatically — making finding data stories really freaking easy.
I’m not a sophisticated data guy, but these data solutions helped me discover some impressive hidden insights about human collaboration and how we can get better at it. What I learned by sifting through data ended up being the stuff that gets people talking about books like mine at the bar or in the boardroom.
So even though I’m not a scientist, these days I kinda feel like one.
Related Stories

How Team USA uses data to build a digital HQ
 February 8, 2022

Data trends that will impact you in 2022

Healthcare Analytics Hub Starter Kit: Get the data you need faster
 October 18, 2019
The purpose of the Healthcare Analytics Hub Starter Kit is to provide a sample of what your healthcare app could look like. It’s not a complete solution; instead, it’s focused on what’s possible. Please contact your Tableau Account Manager to get started today!
Subscribe to our blog
Get the latest Tableau updates in your inbox.