Viz Roundup: Airbnb Rates, British Monarchs, & Mass Shootings in the US


Airbnb Prices in San Francisco
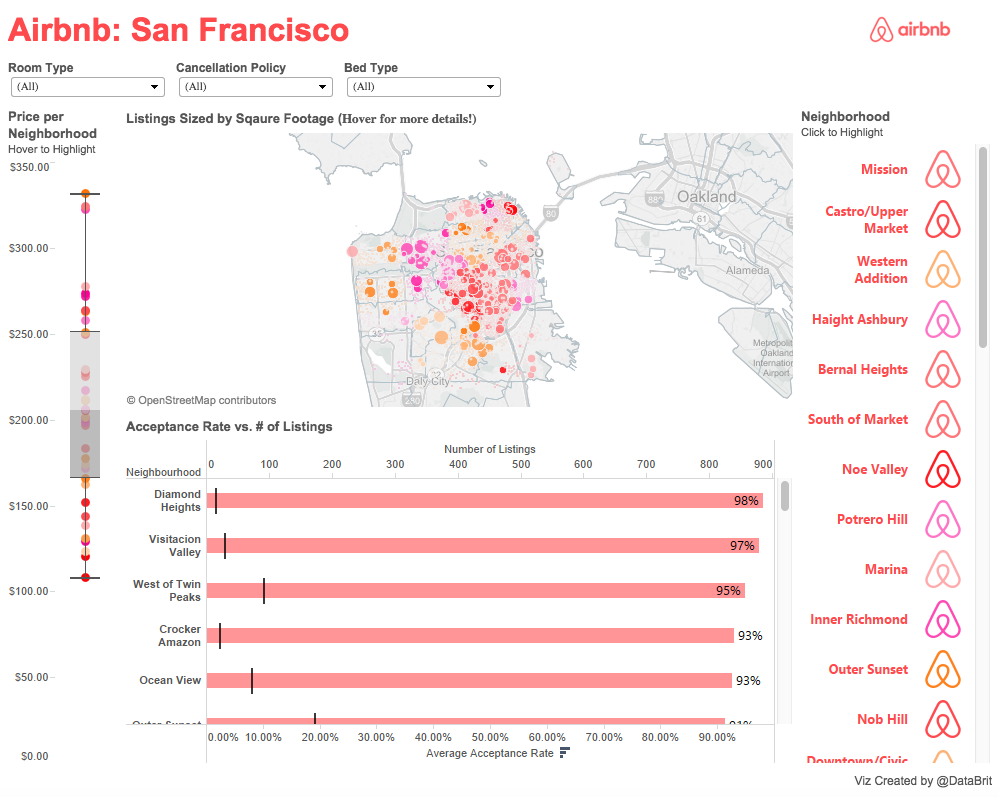
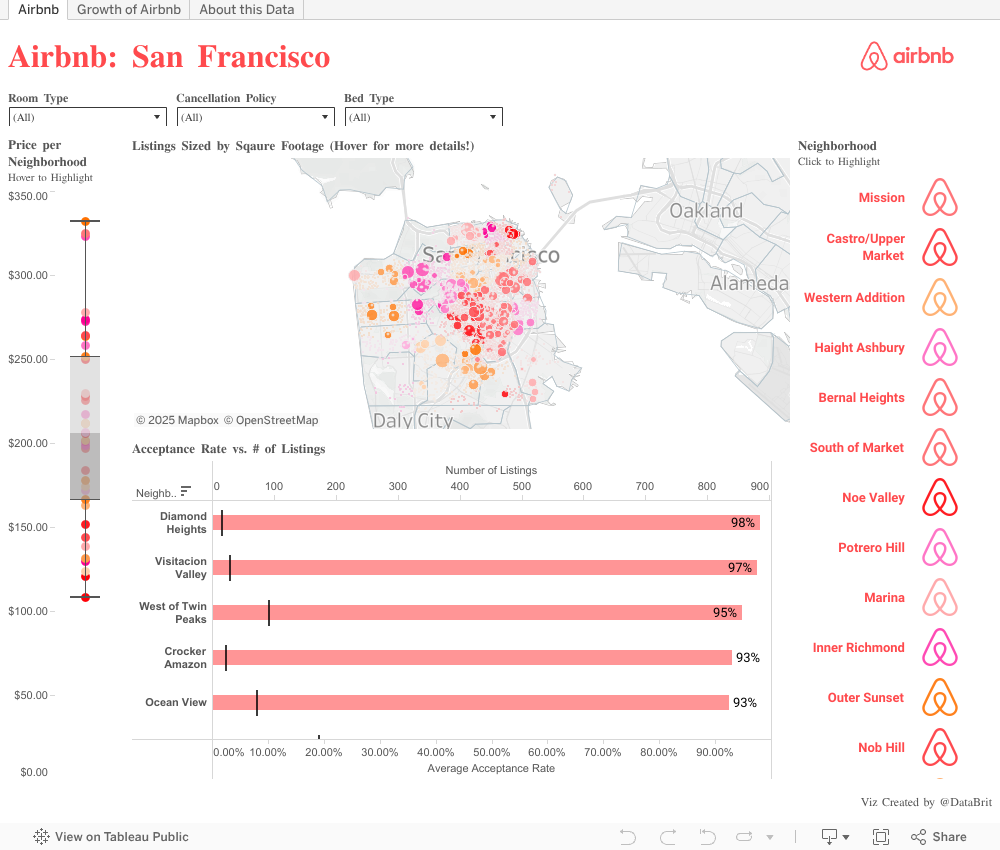
Brit Cava made a map of Airbnb prices in San Francisco, including average acceptance rates and prices by neighborhood. Note the average prices of some neighborhoods is more than $300. And it's a topical map, given Airbnb's embattled state with the city of San Francisco.
Brit attended the "Every Data Rockstar Needs a Stage" blogger panel at Tableau Conference 2015 and was inspired to send this in.
Monarchy in the UK
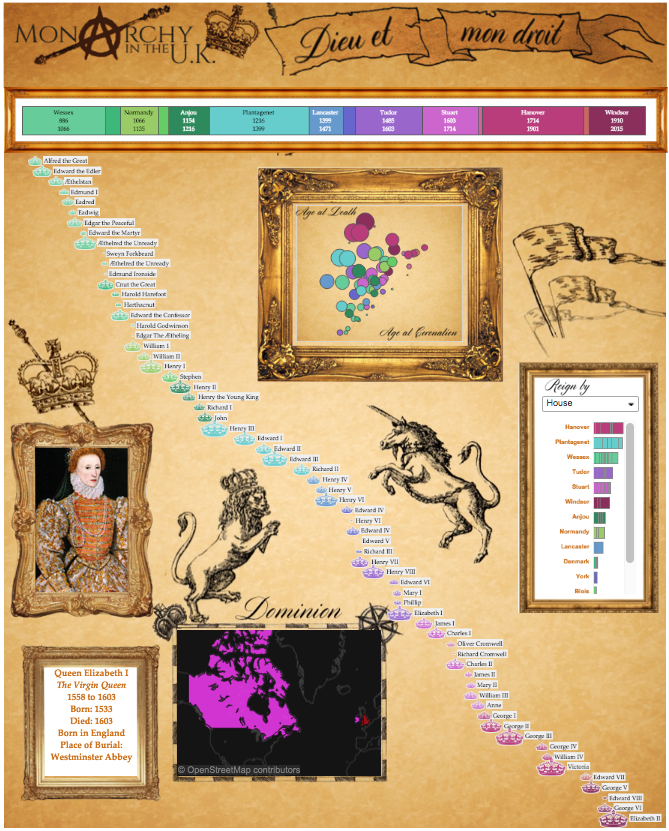
Peter Gilks visualized the many different reigns of UK monarchs using images that evoke the style of the era, complete with a rotating portrait of each monarch.

The Peruvian Election
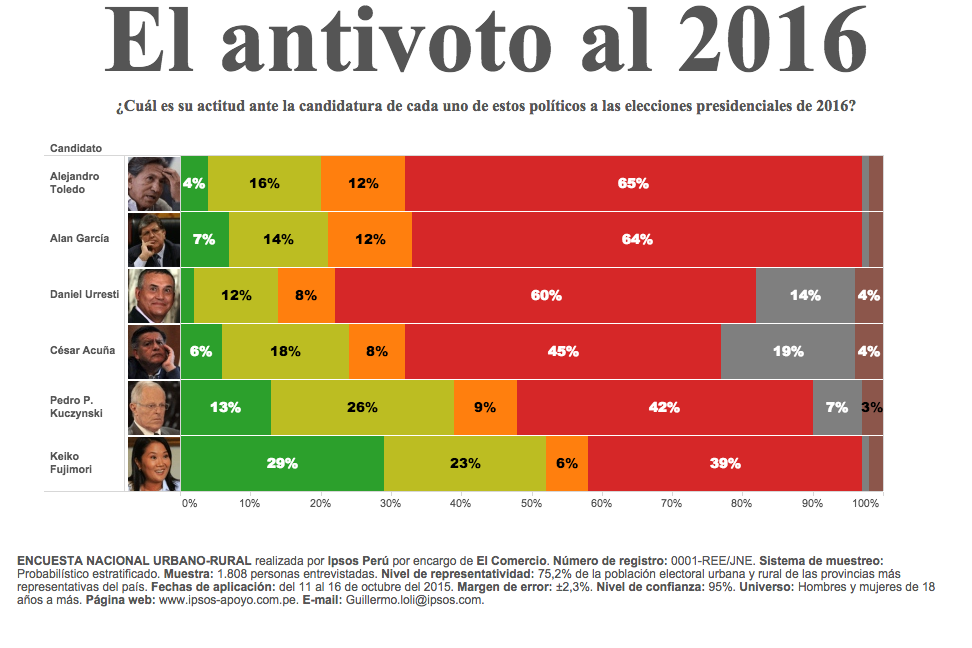
Peruvian newspaper El Comercio looked at the popularity of different presidential candidates in the 2016 election.
(Legend: dark green = Will definitely vote for candidate; light green = might vote for candidate; orange = will probably not vote for candidate; red = definitely will not vote for candidate; brown = Don't know the candidate; grey = NA)

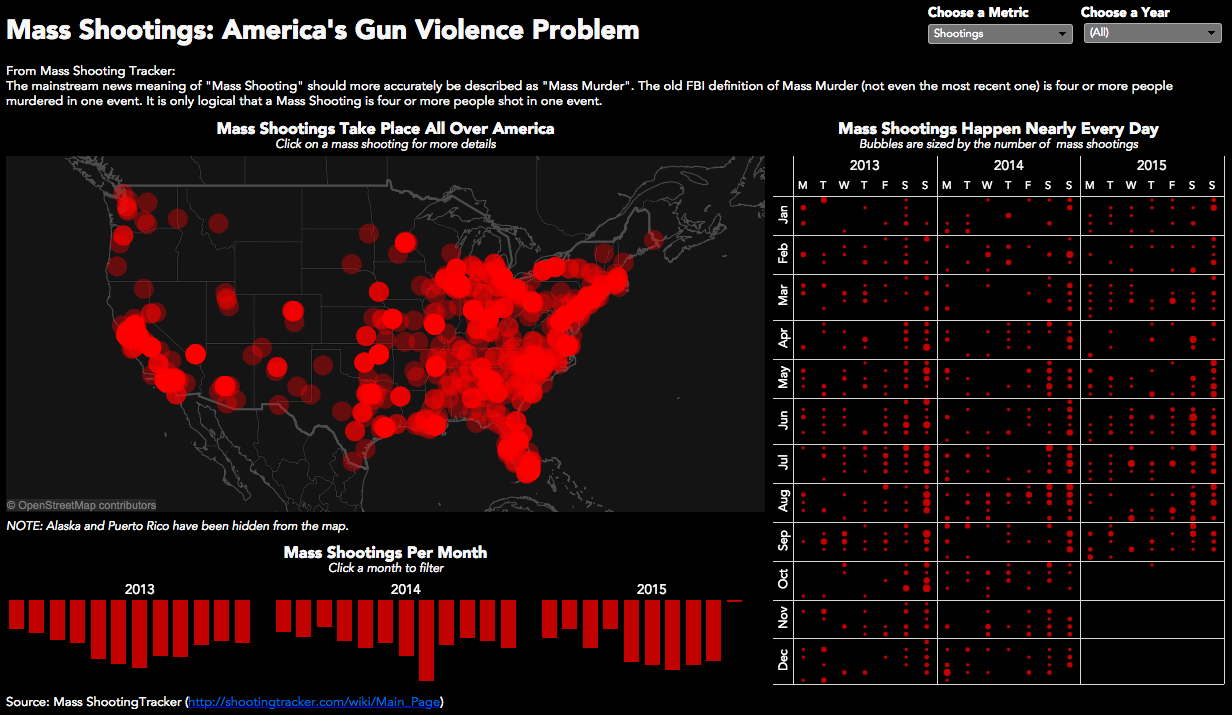
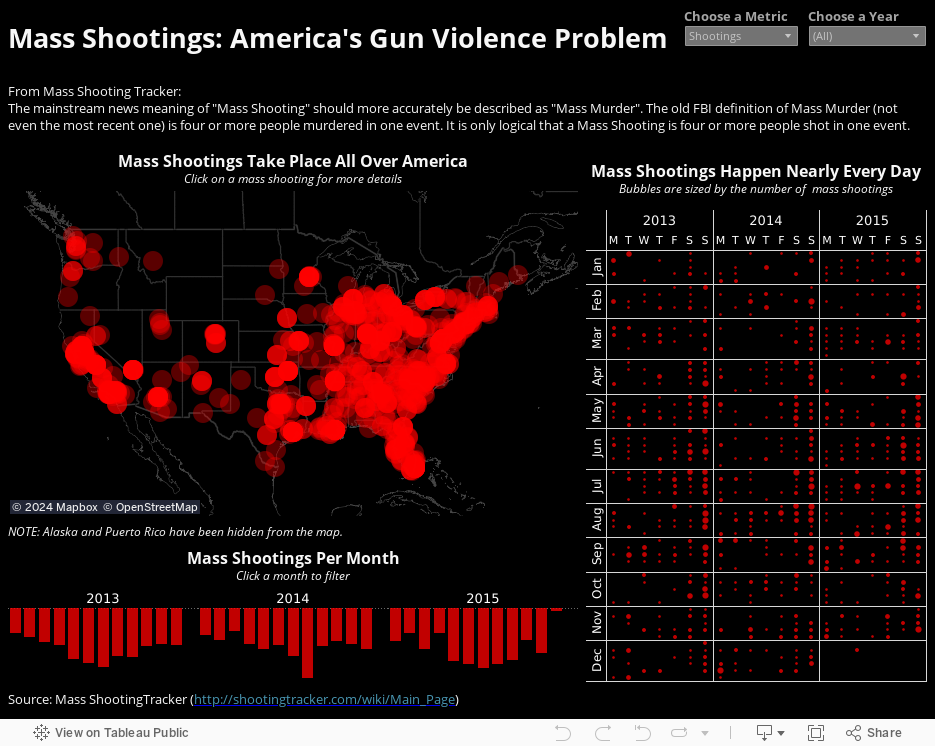
Mass Shootings: America's Gun Violence Problem
Andy Kriebel looked at gun violence in the US. Kriebel visualized just how frequently mass shootings take place in the US, and he used an appropriately macabre canvas.
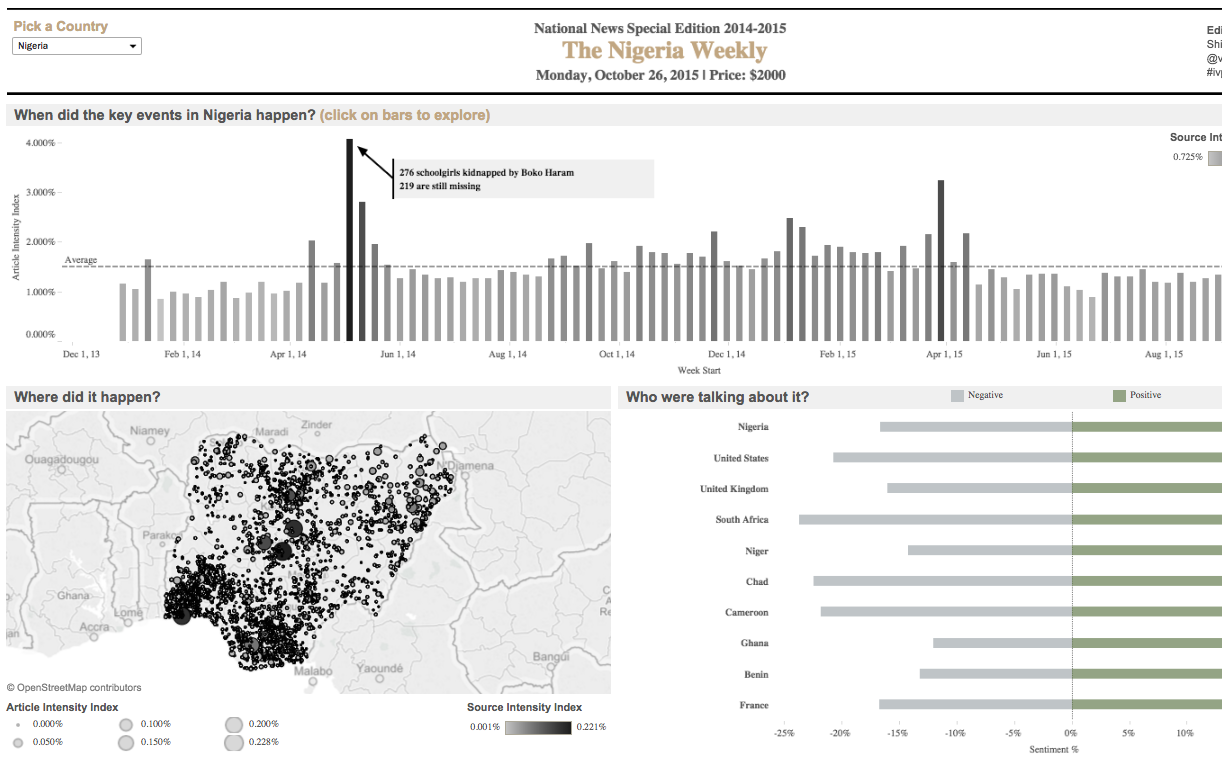
The Weekly News – Iron Viz 2015 Champion
This eye-catching viz was created by Shine Pulikathara in just 20 minutes, earning him the title of 2015 Iron Viz champion! Shine visualized a GDELT data set to examine global news coverage since January 2014. (Bonus: Shine shared, in 10 steps, what it takes to win Iron Viz.)

We hope you enjoyed this roundup. Follow Tableau Public on Twitter to see every beautiful #VizofTheDay. Till next time!
Subscribe to our blog
Get the latest Tableau updates in your inbox.