Surveys of Vendors' Customers Showcased in Gartner's Reports
Gartner is the world's foremost information technology and business systems analyst firm. So when they come out with new reports about the Business Intelligence market, people sit up and take notice. Based on surveys of customers from over 20 different software platforms, these reports take an in-depth look at market trends, vendor functionality and customer satisfaction. Here we're touching on some of the findings from these reports, which are available at the links below:
- "Magic Quadrant* for Business Intelligence Platforms" by Rita L. Sallam, Bill Hostmann, James Richardson, Andreas Bitterer, January 29, 2010
- "BI Platforms User Survey, 2010: Customers Rate Their BI Platform Vendors" by Rita L. Sallam, February 5, 2010
- "BI Platforms User Survey, 2010: Customers Rate their BI Platform Functionality" by Rita L. Sallam, February 5, 2010
Magic Quadrant

This Magic Quadrant graphic was published by Gartner, Inc. as part of a larger research role and should be evaluated in the context of the entire report. Gartner's highly regarded Magic Quadrant* for Business Intelligence is based on Gartner’s detailed customer surveys, interviews and analysis.
Vendors are placed on the quadrant based on 2 dimensions: "Ability to Execute" and "Completeness of Vision". Tableau was placed as a "Challenger." Many organizations will only consider software vendors that appear on the Magic Quadrant.
Overall Customer Experience
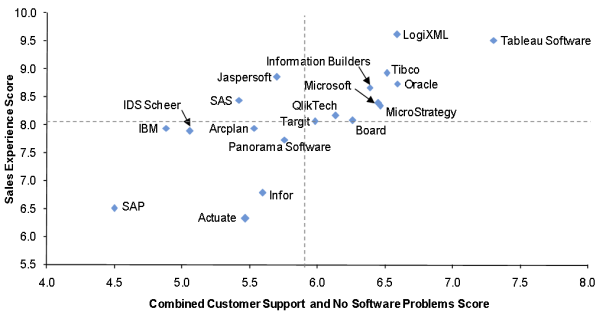
This graph is based on customer ratings of all vendors on two factors: “Combined Customer Support and No Software Problems Score” and “Sales Experience Score.” "Combined Customer Support and No Software Problems Score" represents the experience of using the software after the sales process while "Sales Experience Score" reflects customers experience during the selling process. Tableau is very pleased with our position on the graphic and specifically with how our customers evaluated us on the two factors. We work really hard at both those areas and we’re grateful that our customers recognize that.
Ratings of Support and Software Quality
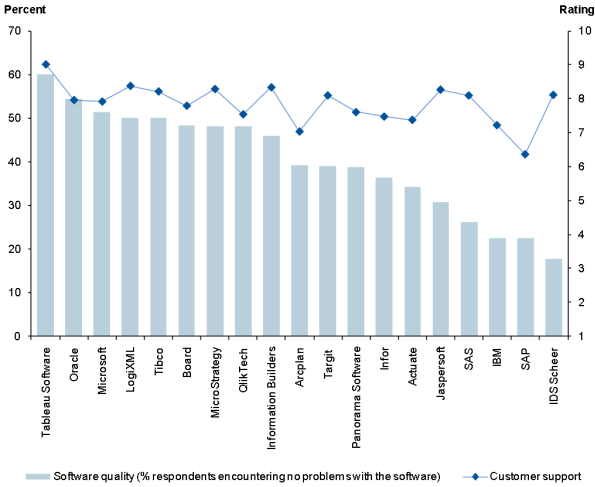
This graph looks more closely at “Combined Customer Support and No Software Problems Score”. There are 2 factors at play: percent of respondents encountering no problems with the software (the bars) and the average rating customers gave support (the line).
When you compare those software quality scores (again, the bars) to support quality (the line), it’s obvious there is little correlation between the two across all vendors.Tableau customers are obviously pleased with both our software quality and support quality. We'll continue to make investments to make sure we continue to meet your expectations.
Product Score vs Breadth of Product Use

The scatter graph here plots overall product functionality score (how well the platform matches users' needs) against derived breadth of use. While both dimensions are critical, breadth of use suggests how useful the platform is for a wide range of applications. Often a platform with a wide range of functionality can return a higher ROI because it can be effectively used to solve more business intelligence challenges.
Customers Using Vendor Platforms for BI Activities

The survey asked about reporting, ad hoc analysis, dashboards, scorecards and predictive analytics. The bars show the percentage of customers using the software for each function and the total of all those percentages for each vendor (which therefore exceeds 100%).
The longer the bar, the more analytical use customers reported for the vendor. Tableau Software is the last bar on the graph.
Watch the video below to get a quick overview of these results and a short demo of Tableau.
More About Tableau’s Products
Tableau’s business intelligence products let IT give business users the ability to explore and analyze their data independently without waiting for custom IT-created reports. Tableau gives analysts exactly the power and access they been crying for. Unlike virtually every other vendor in the graph above, users can create their own analytics all within IT's security and database protocols. Tableau lets analysts rapidly create dashboards and reports on their own while helping IT avoid getting stuck writing BI reports or introducing new data silos that other BI platforms require. Organizations using Tableau get:
- Rapid analysis & discovery: explore, not just graph data, to identify trends and outliers.
- Self service: get data when and how you want it -- IT doesn't have to create new reports.
- Infrastructure fit: software that reads virtually every file type and fits right into your existing database, security and IT architecture. Analysts are faster and more effective; IT's support burden is dramatically reduced.
- Ease of deployment and maintenance: install in minutes, without the need for professional services or a long implementation phase. Little ongoing maintenance is needed.
Tableau is a software company that’s finally doing business intelligence right: giving business people the tools to get answers right now, right when it's needed within the organization's IT framework. Based on breakthrough technology from Stanford University, Tableau is the next generation of business intelligence software. It’s fast, easy and beautiful.
Download our free trial and find out what Gartner’s clients already know.
* Gartner Disclaimer
The Magic Quadrant and related reports are copyrighted January 29, 2010 and February 5, 2010 by Gartner, Inc. and are reused with permission. The Magic Quadrant is a graphical representation of a marketplace at and for a specific time period. It depicts Gartner’s analysis of how certain vendors measure against criteria for that marketplace, as defined by Gartner. Gartner does not endorse any vendor, product or service depicted in the Magic Quadrant, and does not advise technology users to select only those vendors placed in the “Leaders” quadrant. The Magic Quadrant is intended solely as a research tool, and is not meant to be a specific guide to action. Gartner disclaims all warranties, express or implied, with respect to this research, including any warranties of merchantability or fitness for a particular purpose.