NFL Salary Viz, Hex Map Tutorial among Best of the Tableau Web


Here in the US, November is a special month. It’s when we come together as a country to celebrate Thanksgiving with all the food, family, and holiday fun that entails. It’s also the month when we indulge in another quintessentially-American tradition, football.
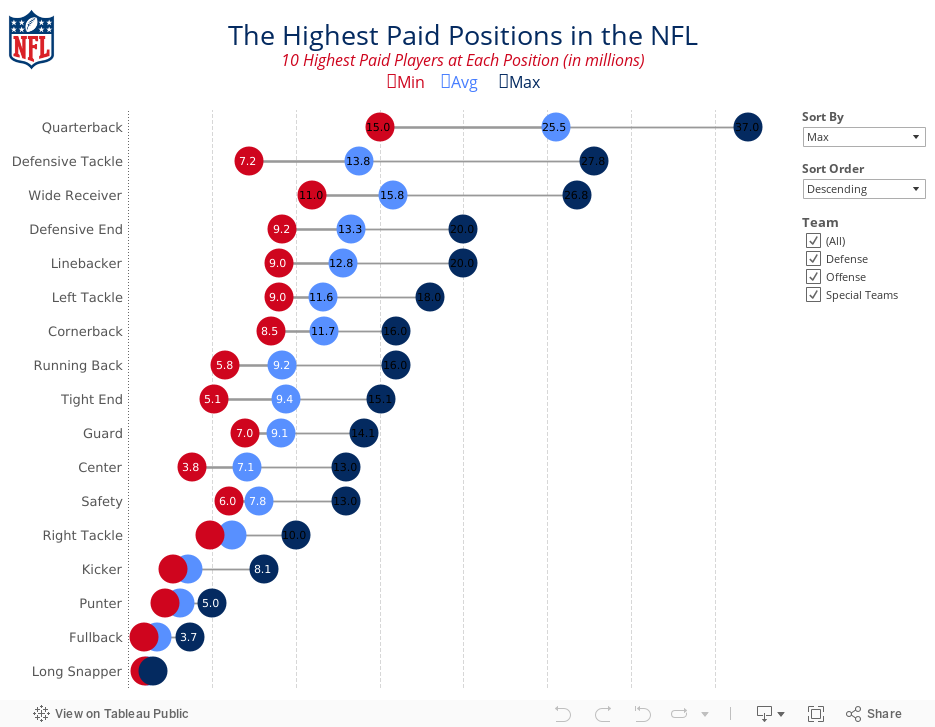
Here's a dashboard that breaks down the NFL's salary data by position. Author and Tableau Zen Master Andy Kriebel also shared his thought process behind the design of the viz.
And here's the rest of the best of the Tableau web for the month of November:
Tips & Tricks
Paint by Numbers A Practical Introduction to Context Filters in Tableau
Business Analytics Send an Email from Tableau
Tableau and Behold! Scheduled Emails from Embedded Tableau Visualizations
The Last Data Bender Generating High Resolution Images of Tableau Views
Drawing with Numbers Getting Rid of 'Year of' for Dates
VizPainter Tableau Tips & Options for Box and Whisker
Visualising Data Colour Swatch Alternatives to Red and Green
Beyond the Basics
Tableau Renders Responsive Dashboards in Tableau
Tableau Zen Override Tableau Action Filters Using Other Action Filters
VizWiz How to Create Multi-Row DNA Charts
Sir Viz-a-Lot Hex Tile Maps in Tableau
Data + Science Creating a MLB Bar Code Chart in Tableau with Custom Team Colors
Evolytics How to Map Anything in Tableau
Jedi
The Information Lab Creating Polygons of Any Image in Tableau
Tableau Friction Hack Academy: Multiple Moving Averages
Datatonic Dynamic Geo-Optimization in Tableau Using R-Integration
Tableau Server
Tableau and Behold! Using Tableau JavaScript API to Fill Parameter from a Selection
Tableau Love The Mondo #Tableau Server TabJolt Post Series - Part 1
Tableau Love Should I Split My Single Tableau Server 8-Core Box into Two 4 Cores?
VizNinja How to Properly Back up Your Tableau Server
On Design
Datasaurus Rex The Best Graph Ever Drawn
Data Remixed Confusing Colors
Bonus: Vizzes on Thanksgiving + Football!
Interworks 19 Years of Bedlam Football Odds Visualized in Tableau
Flowing Data Thanksgiving Flight Patterns
Sir Viz-a-Lot The History of the NFL
Do you blog about Tableau? Tweet us @tableau and let us know.
Subscribe to our blog
在您的收件箱中获取最新的 Tableau 更新。