Digitizing and Understanding Global Infrastructure Data
What is infrastructure? According to The Economist it's "The economic arteries and veins. Roads, ports, railways, airports, power lines, pipes and wires that enable people, goods, commodities, water, energy and information to move about efficiently."
Chris Gage, Director at Turner & Townsend, a leading global programme management and construction consultancy, explains how Tableau enables him to make data-driven decisions about world-wide infrastructure projects and investments during his Tableau Conference on Tour session this week.


What is infrastructure? The Economist defines it concisely as, "The economic arteries and veins. Roads, ports, railways, airports, power lines, pipes and wires that enable people, goods, commodities, water, energy and information to move about efficiently."
Chris Gage, Director at Turner & Townsend, a leading global programme management and construction consultancy, explains how Tableau enables him to make data-driven decisions about world-wide infrastructure projects and investments during his Tableau Conference on Tour session this week.
Using Tableau for operational insight and decision support in the construction industry
Infrastructure is a complex topic with a vast amount of data. Using Tableau has enabled Chris to condense the large quantities of information down to relevant insights. Prior to Tableau, he relied on tedious Excel reports that failed to tell a compelling story and did not enable control over the content once issued.
Turner & Townsend uses Tableau primarily for decision-support. Chris is able to draw simple insights from mountains of data to bring clarity to his decision-making. "Tableau’s visualization prowess combined with server and mobile deployment makes evidence-based decision-making quick and intuitive", he explains. The visualization and storytelling capabilities also help to convince clients and influence public opinion by explaining complex topics in an engaging way.
Tableau for Data communication
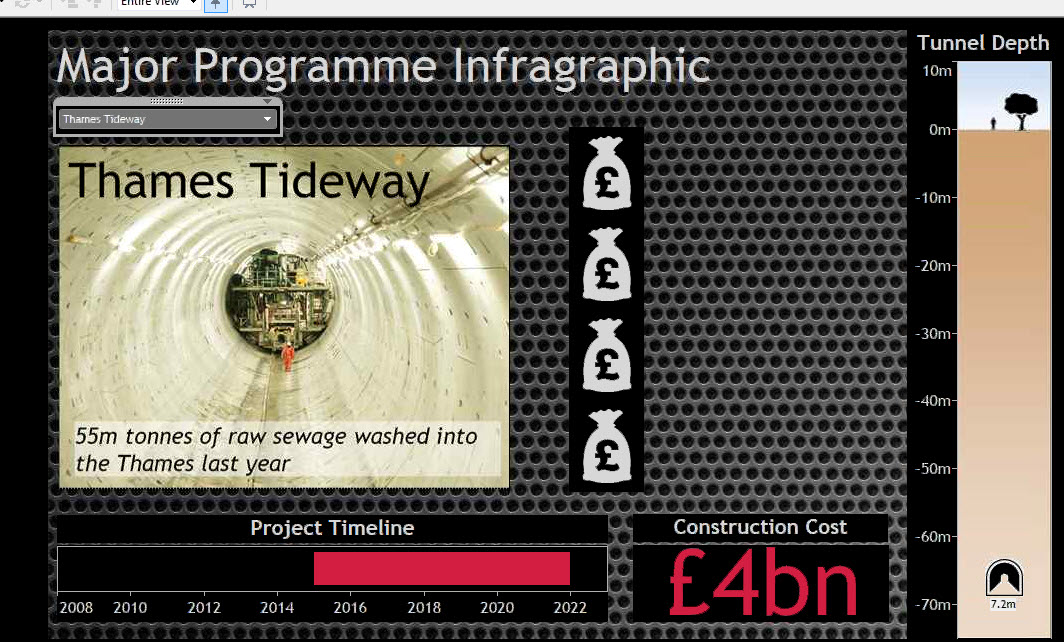
During his Tableau Conference on Tour in London session he walked through several infrastructure case studies. First up, the Thames Tideway project. In this dashboard Tableau is used as an infographic, but with the added benefit of being interactive rather than static.
Decision modeling in Tableau
He also built an investment decision model in Tableau. Users can decide on thresholds based on importance of priorities vs. performance. Chris explains his motivation for building the visual model bluntly when he states, "The answers are in the data."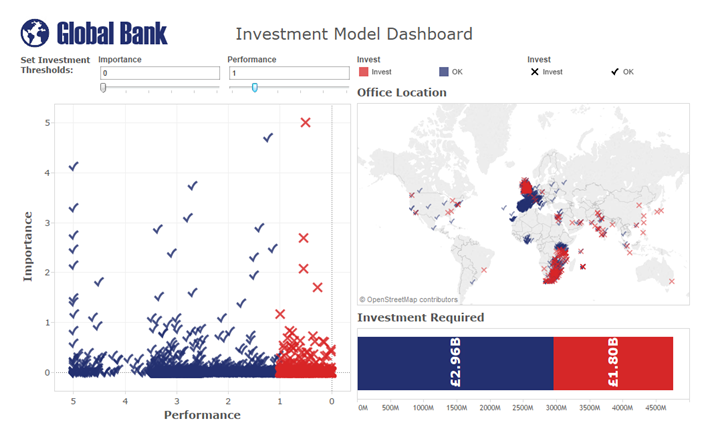
Infrastructure usage statistics for maintenance planning
In the third example Chris is able to demonstrate rail station usage across the UK. These help his clients understand which stations may require more maintenance and government funding.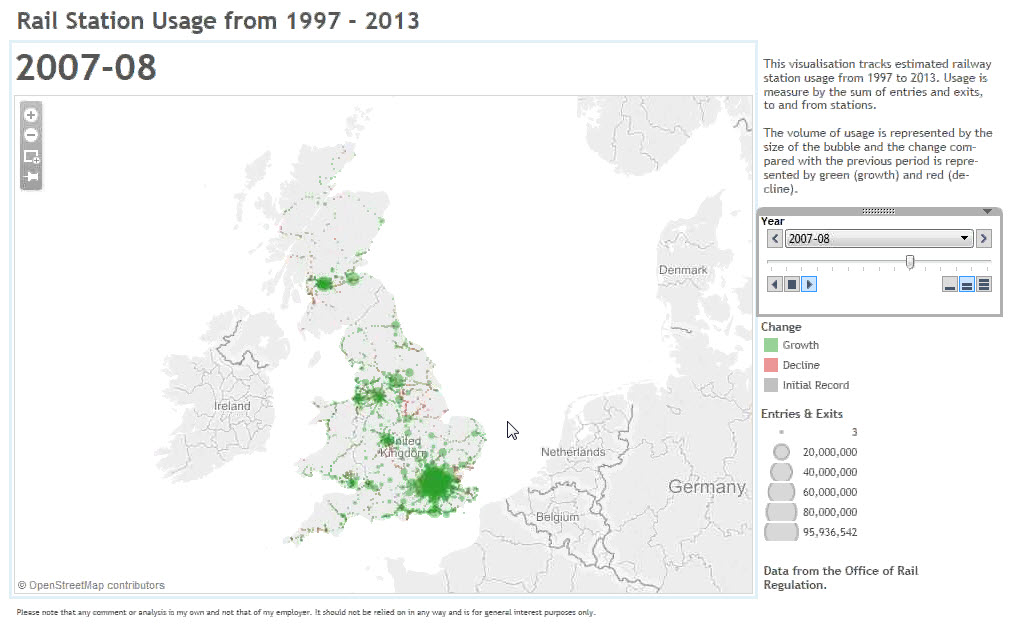
In addition to using Tableau for infrastructure investment decisions and consulting, Chris recently experimented with adding Tableau to Towner & Townsend's recruiting process. Two interview candidates who had never used Tableau were given instructions to download Tableau's free version, Tableau Public, and two days to prepare a thirty minute presentation using publicly available infrastructure data.
Chris says the results were astounding. After just a matter of hours the recent college graduates who had never touched Tableau had created insightful reports from enormous quantities of data. The ability to condense complex data into a clear story is an invaluable career skill in the data-heavy world of infrastructure. Chris expects to continue to incorporate Tableau into his hiring process given the success of the trial.
His conference talk came full circle from using Tableau on-the-job to using it to get the job. You can view Chris' presentation slides on his blog here.
相关故事

How Team USA uses data to build a digital HQ
 2022/02/08

Data trends that will impact you in 2022

Healthcare Analytics Hub Starter Kit: Get the data you need faster
 2019/10/18
The purpose of the Healthcare Analytics Hub Starter Kit is to provide a sample of what your healthcare app could look like. It’s not a complete solution; instead, it’s focused on what’s possible. Please contact your Tableau Account Manager to get started today!
Subscribe to our blog
在您的收件箱中获取最新的 Tableau 更新。