Tips & Tricks from the Wild at TCC12


TCC Data viz wizard Andy Cotgreave MC'd the Tips & Tricks in the Wild session on Wednesday afternoon. Topics amongst the four speakers ranged from speeding ticket data to automation using Tableau's command line tool tabcmd.
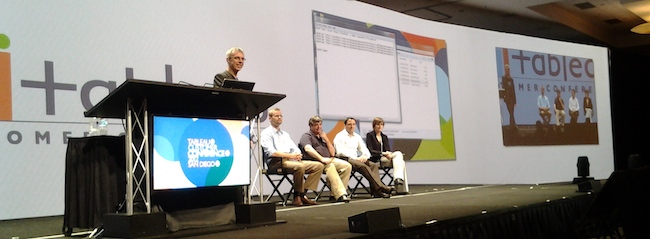
The Tips & Tricks breakout session was so popular it had to be moved to a larger room to accomodate the crowd.
Alex Blakemore of Apogee Integration LLC started off by making a case for how to avoid misleading interpolation in line charts when the underlying data only has two states (such as in stock or out of stock). By inserting rows to fill in time gaps, Blake was able to plot accurate queue length line charts with Tableau.
Next, blogger Ben Jones at Data Remixed showed how to use Tableau with mined speeding ticket data to discover underlying trends with statistical process control charts. The takeaway from this talk was that the whole story may be more subtle than a first impression would suggest from looking at the raw data.
Santiago Restrepo, founder and CEO of Consumer Goods Analytics, explained to the crowd how to tailor the range of colors to a data set by using the standard deviation as the basis for the color scheme. Using a map of the U.S., Ristrepo demonstrated that this approach would produce a color scheme that would adjust to different ranges of data and also highlighted outliers. He used a calculated field to produce these results, but suggested that future versions of Tableau could offer a Min-Max function in the color window based on a rank or standard deviation of the data. See the map from this session at http://consumergoodsanalytics.com/news/2012-tableau-customer-conference-...
Interworks' BI Consultant Kate Treadwell showed the audience of Tableau champions how to use the program Tabcmd to automate the production and distribution of timely and accurate reports from Tableau Server. Tabcmd ships in the Extras folder of Tableau Server.
A Q&A session with the speakers followed the formal presentations. Afterward, attendees lingered to chat and recount Tableau stories going back to the first versions of the product.
Subscribe to our blog
在您的收件箱中获取最新的 Tableau 更新。