Tableau Community

Tableau Ambassadors

Community Leaders who create opportunities for connection, growth, and inspiration

The community is built on a bedrock of sharing, inspiring, and educating. Being a part of the community is a pleasure, and representing it is an honor.

RAVI MISTRY, TABLEAU PUBLIC AMBASSADOR

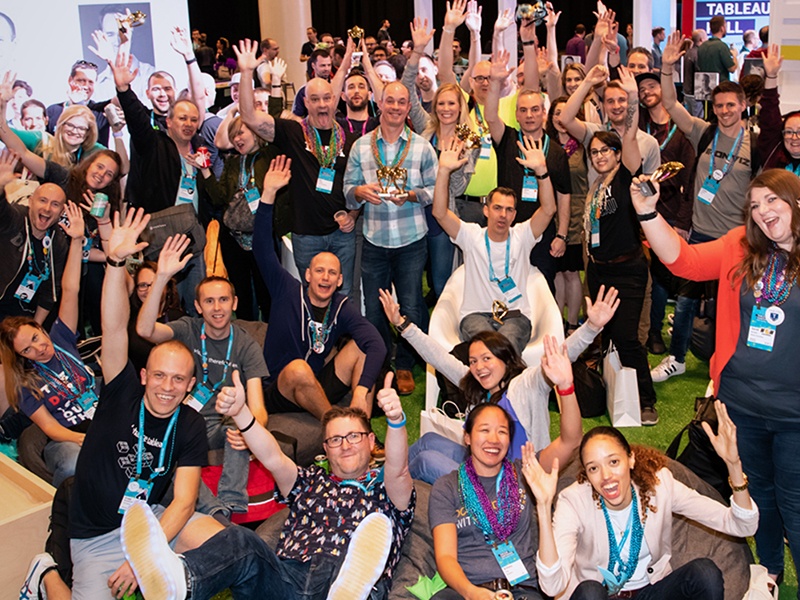
Tableau Ambassadors embody the spirit of the community

Tableau Ambassadors teach and share while fostering a positive and supportive space within the community. They give credit where credit is due, and prioritize inclusivity in everything they do. They shine the spotlight on new voices, innovative ideas, and make the communities around them better. Tableau Ambassadors serve in one of seven branches: Forums, User Groups, Academic, DataDev, Public, Social and CRM Analytics.

What it takes to be a Tableau Ambassador

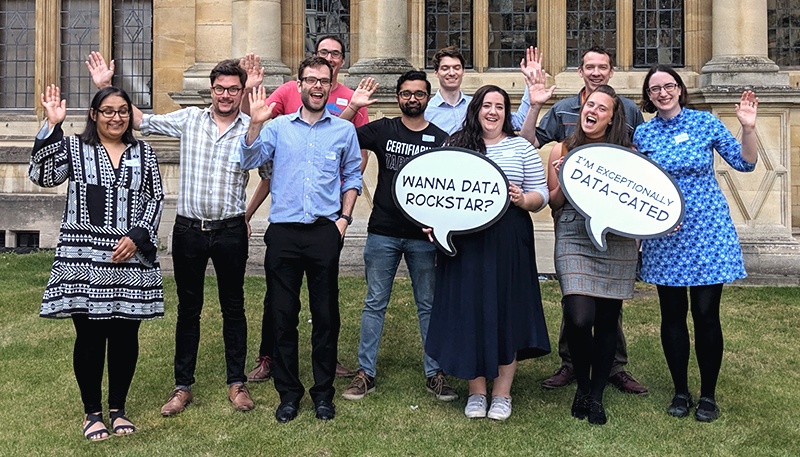
BECOME A TABLEAU AMBASSADOR

Get all the details on applying or nominating others to become a Tableau Ambassador. We can’t wait to meet you!
Learn More

See the latest from Tableau Ambassadors

Tableau Ambassadors are community leaders and evangelists

Discover the critical role each branch plays in the larger community and the responsibilities involved.


Community Forum Ambassadors

Tableau Forum Ambassadors are the stewards of the forums, helping maintain a healthy and engaged community forum by assisting users with quality responses, flagging inappropriate content for moderation or removal, and approving new users’ content .


Adam Gilstrap

View Profile

Adam Gilstrap

Overland Park, KS, United States of America
Adam is a Senior Financial Reporting Specialist at the FDIC (Federal Deposit Insurance Corporation…you’ve heard of us in every banking commercial ever “member FDIC”). He began working for the FDIC in August 2012. Like most new employees he was looking to stay busy his first few weeks. A colleague (for whom he is forever grateful) said “we have this new thing called Tableau…you should try to figure it out…it would be a good feather in your cap. Adam soon realized his true professional love was efficiency and replacing manual with dynamic. Tableau made this all incredibly easy while also making it look incredibly cool. A couple years later Tableau Server arrived at FDIC which motivated Adam to finally learn SQL. With the entire reporting lifecycle at his fingertips from database to inbox, Adam helped Tableau popularity explode at the FDIC. Looking for a way to collaborate and share ideas remotely, Adam started the FDIC TUG (Tableau Users Group) in June 2020. The group quickly became popular and has developed a web of Tableau power users and novices working together at the FDIC. Along the way Adam decided to make his Tableau skillset official by earning a certification. He was discouraged to fail his first attempt to become Tableau Desktop Certified (he swears his dog barked the entire exam). Now more prepared and taking the exam at a testing center (no barking) Adam earned his certification on his second attempt. In February 2022 Adam added a Tableau Data Analyst certification with the Early Bird designation (1 of the first 1000 to pass the exam worldwide). Adam earned a Bachelor’s degree in Accounting and a Master’s in Accounting and Information Systems from the University of Kansas. He lives in suburban Kansas City with his wife, 3 children and dog (still barks a ton). Most of his free time is spent with his family. He loves playing sports with his kids and being in nature. He dabbles in sports cards and collectibles but his main hobby is home projects and fixing things.

Adrian Zinovei

View Profile

Adrian Zinovei

Stoney creek, Canada
Adrian Zinovei is a passionate Tableau Developer based in Toronto, Canada. With over a decade of experience, he's been a trusted consultant to top companies in the region. Adrian's Tableau journey began ten years ago, and he's been continuously amazed by the tool's evolving features and capabilities. As a co-leader of the Toronto Tableau User Group (TUG), he fosters a vibrant community of data enthusiasts, sharing insights and best practices. Beyond his professional endeavors, Adrian serves as a dedicated board member of Viz for Social Good, where Tableau becomes a powerful tool for visualizing data to help those in need. At his workplace, he's earned a reputation as 'the guy who can deliver the impossible.' He thrives on extracting the best value and insights from data, holding certifications as a Data Scientist and a fervent passion for Machine Learning. Adrian's guiding motto is simple yet profound: 'If you stop learning, you start dying.' He lives by this mantra, continually seeking new challenges and opportunities to expand his expertise.

Alvino Vaz

View Profile

Alvino Vaz

Mumbai, India
Alvino Vaz is a Data Visualizer working at an American financial services firm developing interactive front-end dashboard solutions. He has over 8 years of progressive experience in Business analysis, Reporting and Dashboard development using Tableau and Alteryx across various industry verticals. Alvino actively engages to provide value added solutions to folks on Tableau forum and believes in growth through constant learning. He is also passionate about all things fitness and work out from measuring calories to maintaining a healthy lifestyle apart from being a certified fitness and nutrition consultant.

Amy Wu

View Profile

Amy Wu

Lakeway, United States of America
Amy Wu is a data geek whose favorite toy was a Little Professor calculator. These days, Amy works as a Sr. B.I. Analyst at JLL, helping companies turn their vision into compelling dashboards and make data-driven decisions. This year, Amy achieved 2x Viz of the Day and JLL Tableau Rockstar status. She also co-founded #Eduvizzers, a community data group committed to transforming educational datasets into outstanding visualizations. She holds a Ph.D. from UT-Austin and a M.B.A. from Texas State University, San Marcos. In her spare time, she enjoys swimming, taking daily walks with her husband, and travelling internationally.

Ashish Bansal

View Profile

Ashish Bansal

Hyderabad, India
I Ashish Bansal is a Business Intelligence (BI) Analyst, dedicated to unravelling the secrets hidden within data and transforming them into actionable insights. With over a decade of experience in the field, I have honed my skills in data analysis, visualization, and strategic decision-making. In this bio, I will take you on a journey through my career, skills, achievements, and unwavering commitment to the world of BI. My journey into the realm of data began with a solid educational background. I earned my bachelor's degree in computer science, equipping me with the technical prowess necessary for data analysis. This academic foundation laid the groundwork for a fulfilling career driven by a passion for extracting knowledge from raw information. My career in BI started humbly, as I began my professional journey as a Junior Analyst. Here, I embraced the opportunity to develop my analytical skills and acquaint myself with the intricacies of data collection, cleansing, and interpretation. My dedication and thirst for knowledge propelled me to higher roles and responsibilities within the organization, setting the stage for a fulfilling career. My key skills and expertise are in Data Analysis, Data Visualization, Business Alignment, Problem-Solving and Collaboration. Recognizing the importance of knowledge sharing, I actively engage in mentorship within the BI community. I take pleasure in guiding aspiring analysts, helping them navigate the complexities of data analysis, and nurturing the next generation of data professionals. I am a firm believer in continuous self-improvement and professional growth. I actively seek out opportunities to expand my skill set through workshops, certifications, and staying abreast of the latest trends in the BI landscape. My commitment to learning ensures that I remain at the forefront of my field. Outside the world of BI, I am an avid traveller and a photography enthusiast. Exploring new places and capturing moments through my lens mirrors my approach to data analysis – seeking fresh perspectives and uncovering hidden insights in both my professional and personal endeavours. As a BI Analyst, my journey is a testament to the transformative power of data. My blend of technical expertise, strategic thinking, and unwavering commitment to excellence continues to drive my career and make a lasting impact on the organizations I serve. I stand ready to face new challenges, uncover new insights, and forge new paths in the ever-evolving landscape of Business Intelligence.

Ayinde Oluwatosin Hammed

View Profile

Ayinde Oluwatosin Hammed

Ibadan, Nigeria
Ayinde Hammed, a resident of Nigeria, has earned the prestigious title of Tableau Ambassador three times in a row due to his passion for tackling intricate data problems. He achieves this by applying a mix of mathematics and critical thinking. His Tableau journey began around four years ago, and since then, he has actively participated in the Tableau community, mastering the use of Tableau Desktop and other Tableau products to solve a wide range of challenges. What sets Hammed apart is his unique approach to problem-solving, combining analytical thinking with mathematical expertise, enabling him to address complex data issues with precision and innovative solutions. His consistent contributions to the Tableau community reflect his dedication to utilizing Tableau as a powerful tool for addressing intricate data challenges, serving as an inspiration to aspiring data enthusiasts worldwide.

Bryce Larsen

View Profile

Bryce Larsen

Palo Alto, United States of America
Bryce is currently a consultant with Slalom in Silicon Valley. Prior to this he spent a decade working in the healthcare industry. He has been using Tableau since 2015 and came to know the tool through the Community Forums, so he appreciates the opportunity to assist others in return. Bryce focuses on automation with Tableau’s APIs to help automate the boring work.

Budi Lubis

View Profile

Budi Lubis

Westport, CT, United States of America
Mentoring others to grow with Tableau, and leading business transformations anchored on data and Tableau have become hobbies for Budi. He is a global commercial leader in healthcare, and leverages his sales and marketing experiences to simplify answers with visualization. An all-rounder, loves solution-oriented challenges in the community, and always starts in the unanswered questions section. He is member of board of local food pantry and volunteers at non-profit organizations with their data and technology needs; explore new countries with family during kid's school breaks.

Chris Geatch

View Profile

Chris Geatch

London, United Kingdom
Chris currently goes by the title of Data Architect, but has been a problem solver ever since starting as a computer programmer shortly after programs stopped being written in 1s and 0s. With exposure to tens of languages and technologies, there's usually something squirreled away that will move things forward for any given problem, and the forums provide an outlet for his general desire to be helpful. Having over 20 years of experience across multiple airline functions (and their many data foibles), as well as degrees in biology, maths and osteopathy, there aren't many things to which he can't turn his hand. When not at work, he's usually found swimming long distances (then analysing the data).

Chris Monger

View Profile

Chris Monger

Oxford, United Kingdom
A data analyst for about 10 years and a Tableau user for 7, Currently a Senior Business Intelligence Analyst for The Myers-Briggs company, maintaining and running the company Tableau Server as well as providing self-serve and in depth analytics to Sales and Marketing teams. A fan of both delving into the complicated aspects of Tableau and different data sources, as well as creating readable and aesthetically pleasing visualisations for users.

Dan Chissick

View Profile

Dan Chissick

Ramat Yishai, Israel
My name is Dan Chissick and I am the BI Team Leader at Naya Technologies (an Epam Systems company). I have been practicing and enjoying Business Intelligence for over 25 years, and working with Tableau since 2016. My education includes a B.A. in Mathematics and MBA. As a Senior Consultant for Naya, a Tableau Partner, I have been developing reports, managing servers, advising, teaching, presenting, and troubleshooting Tableau for several years as part of my job, while creating for Tableau Public and answering questions on the community in my spare time. Any remaining time is divided between 4 children and the sport of orienteering.

Deepak Rai

View Profile

Deepak Rai

Gilbert, Arizona, United States of America
Presently living in Gilbert, Arizona with my wife Anjana, daughter Tamanna, son Jitesh and a Labrador named Dollar, I originally belong to Ludhiana city in North Indian State of Punjab. Having obtained Master's in Engineering from Indian Institute of Technology, Kharagpur, I received a PhD in predictive analytics as a career scientist in a leading scientific organization in India. I have worked in various scientific organizations in India, Japan and USA generating & analyzing scientific data and have contributed through publications, books, book chapters, presentations as well as by, mentoring peers & students. Since last ten years, I am into the business data analytics and presently working with a top financial institution in Arizona for multiple stakeholders and drive the organization based upon data driven insights. I like to solve complex analytic challenges and love complex calculations at Tableau Forums as well as in my day-to-day work for my peers and team. I am an avid follower of NBA, Soccer and Cricket and like to do gardening and vermicomposting in my free time as well as advise others on backyard gardening.

Diego Martínez

View Profile

Diego Martínez

Colombia, Colombia
Diego is the CTO for Modux, a Tableau Partner. He is a highly Motivated Industrial Engineer with 9+ years experience working with Tableau and Data visualization and 7+ years' expirience in marketing and supply chain. Diego spends his time helping people with all kind of questions in the community, turning raw data into actionable decisions and insights, teaming up with companies to turn them into data driven by using Tableau Platform/Tableau Blueprint, and creating learning videos on https://www.modux.co/webinars-tableau/

Don Wise

View Profile

Don Wise

Los Angeles, United States of America
Please use existing bio...

Donna Coles

View Profile

Donna Coles

Didcot, United Kingdom
Donna is a 7-time Forums Ambassador and 2-time Tableau Visionary. She has been using Tableau for over 10 years specialising in both Tableau Desktop and Tableau Server. She is currently an analytics consultant at Biztory sharing her passion and knowledge of Tableau with a variety of clients. She has been a regular participant of the #WorkoutWednesday community project since its inception in 2017, and recently joined the leadership team. She uses the challenges to really test her Desktop skills and also try out new features, and blogs her solution guides at donnacoles.home.blog.

Garvit Pant

View Profile

Garvit Pant

Hyderabad, India
I am dedicated and experienced Business Intelligence (BI) Server Administrator with a passion for optimizing data-driven decision-making processes. With a background in IT infrastructure management and a strong aptitude for BI technologies, I have played a crucial role in ensuring the seamless operation and performance of BI solutions for organizations across diverse industries. My key skills are BI Server Administration, Security and Access Control, Server Monitoring and Maintenance, Troubleshooting and Issue Resolution, Backup and Disaster Recovery, Collaboration with BI Developers and Analysts, etc. I have hands-on experience in installing, upgrading, deploying, maintaining and configuring Tableau Server on single node as well as multi node server across windows as well as linux environments. I have expertise in TSM & TABADMIN commands to generate a backup, restore, maintenance activities and Tableau Server configuration settings. I have experience with Advanced Tableau Server configurations like SMTP, SAML & SSL. I have experience with log checkers like Logshark. Going ahead I am looking for a great career in the field of Business Intelligence. Outside of the IT world, I enjoy exploring new technologies, reading tech blogs, and staying up-to-date with the latest trends in Business Intelligence. In free time, I also love to explore the world and mostly the nature by travelling.

Hari Ankem

View Profile

Hari Ankem

San Francisco, United States of America
Hari Ankem is an accomplished Data Consultant with a remarkable decade-long journey of crafting compelling data narratives for prestigious Fortune 500 clients. As a testament to my commitment to the Tableau community, I hold the prestigious title of a 4-time Tableau Ambassador, with a consistent presence in the Top 10 of the Tableau Community All Time Leaderboard. My dedication to Tableau is underscored by my certification as a Tableau Desktop Specialist. I bring a wealth of experience spanning diverse sectors including Banking, Energy & Utilities, Pharma, Sales, Marketing, Manufacturing, Insurance, Investment Banking, and Finance. My specialized expertise extends to Tableau Prep and Tableau Desktop, where I excel in advanced calculations using table calculations and Level of Detail (LOD) expressions. My mission is unwavering: to transform data into meaningful insights and to empower others in the Tableau community with my knowledge and passion for data visualization. I'm excited to continue this journey as a Tableau Ambassador in 2023, contributing to the growth and success of our vibrant community.

James Emery

View Profile

James Emery

Atlanta, United States of America
Although I have long been interested in data, my experience with visualization was limited to Excel (and some ArcMap) until my first Tableau course in 2017. It has only been in the last several years, however, that I have incorporated Tableau into my work and have focused on improving my skills. During Tableau Conference-ish 2020, I decided to get certified. My involvement in the Community Forums began as exam preparation, but the satisfaction that I get from helping others has kept me involved. I am an avid listener of podcasts (Econtalk is my favorite) and viewer of British comedy panel shows.


Jim Dehner

View Profile

Jim Dehner

Nashville, United States of America
Jim is a 3-time Tableau Visionary, 7-time Tableau Forums Ambassador, the co-founder of the Tableau Newbie User Group and co-leads that group and the Nashville Tug. He is a fixture on the Forum where he has answered literally thousands of questions – maybe one was yours or you may have heard him speak at TC23 or your local TUG. His blog focuses on helping new and intermediate user enhance their Tableau skills through regular “How-to” and “Use Case” posts (jimdehner.com) and he does a monthly Data Dr session on VizConnect – Jim is passionate about help users learn Tableau and is currently working with Tableau to develop a program aimed at K-12 students – He lives in Nashville, Tn

Johan de Groot

View Profile

Johan de Groot

Andel, Netherlands
Johan is a visualisation and analytics consultant from The Netherlands. Since discovering Tableau a long time ago he has been using it to forge elaborate visualisations, extensive dashboards and do thorough data-preparation. He is the founder of Antichaos - an analytics agency focussed on datavisualisation and -analytics. In addition to creating professional dashboards and supporting companies using Tableau, Johan has also taught many people how to use Tableau, be creative with their data and how to present and analyse that data comprehensively. He can often be found on the Tableau Forum to help members of the community with all things Tableau, and writes at antichaos.nl/blog about creating and extending datavisualisations.

John Barnard

View Profile

John Barnard

Sydney, Australia
John Barnard is a Business Intelligence Consultant with 20 years of experience in Technology and Business Intelligence across many industries including Fintech, Media, Marketing, Construction and Managed Services. John specializes in BI tooling and best practices for operational and reporting analytics and insights generation. Passionate about empowering citizen data scientists, data democratisation, business transformation and uplifting data fluency/literacy, John has delivered positive change and established strong communities, SME groups and forums for peer led support and advocacy. Positive and outgoing, John loves to inspire and mentor others and is inspired in turn by their success.

Joon Kim

View Profile

Joon Kim

Sydney, Australia
Joon Kim is a senior data visualization specialist working for a retail organisation in Australia, who also has experiences in telecommunications and insurance industry. Joon is a Tableau enthusiast who enjoys nothing more than helping others better understand data through visualization and collaborating with members of the Tableau Community to learn and grow together. Joon spends his time outside work on helping answer questions on the Tableau Community Forums, writing blogs to share new learning with the wider audience and participating in the Sydney Tableau User Group as a co-lead.

Katie Kilroy

View Profile

Katie Kilroy

Cork, Ireland
Katie is an experienced and curious data leader with a background in Data Operations, Sales Operations, and HR Operations. She has been a Forums Ambassador since 2021 and leads the Cork, Ireland Tableau User Group. She enjoys helping people out with their Tableau-related challenges and creating visualizations on Tableau Public via the numerous data projects run in the Tableau Community.

Kaustubh

View Profile

Kaustubh

Mumbai, India
I'm Kaustubh, Analyst at Goldstone Technologies Ltd. I've accumulated over 2.5 years of experience working with various components of the Tableau product suite, including Tableau Server, Tableau Desktop, Tableau Cloud, and Tableau Prep. During this time, I've had the opportunity to work across diverse industry domains such as Finance, Healthcare, and FMCG. As a Analyst and a passionate advocate for data visualization, I also aspire to become a data scientist. I'm constantly on the lookout for new opportunities that allow me to grow and contribute to the community. Being an active member of this fantastic community has enabled me to both share my knowledge and learn from others. Tableau's knowledge platform has been instrumental in my journey, providing me with in-depth insights into topics like LODs, Calculations, Dates, APIs, Tableau Server automation, and a wide array of data source connections, including Python and R integration with Tableau. Tableau has played a pivotal role in shaping my professional life, and I'm eager to continue contributing to this vast reservoir of knowledge and expertise.

Ken Flerlage

View Profile

Ken Flerlage

Williamsport, PA, United States of America
Ken Flerlage is a Tableau Evangelist and Consultant at Moxy Analytics (www.moxyanalytics.com), where he helps clients to solve problems with data. He is an active member of the Tableau community, a Forums Ambassador, and a member of the Tableau Visionary Hall of Fame. He spends his time answering questions on the forums, engaging in dataviz discussions on social media, and blogging on flerlagetwins.com, a site that he shares with his identical twin brother and fellow Tableau Visionary, Kevin Flerlage.

Konstantin Weis

View Profile

Konstantin Weis

New York, United States of America
Konstantin, a Senior Data Consultant from Germany, began his Tableau journey during his graduate studies at Fordham University. He furthered his expertise during an internship and active participation in the Tableau Forums, where he now thrives. Engaging with the Tableau community, Konstantin is also co-lead of the New York City TUG. As a Data Consultant, he has worked with a variety of clients across several industries and is versatile beyond data visualization, from data modeling to data engineering. Beyond data, he's passionate about soccer and basketball. When not crunching numbers, he's in the kitchen trying new recipes or exploring NYC‘s culinary scene.

Laura Peterson

View Profile

Laura Peterson

New York, United States of America
Laura Peterson is the Director of BI Enablement for the Americas region at JLL, based in New York City. She is passionate about helping people see and understand data and specializes in upskilling analysts in Tableau and Alteryx. Laura has an MBA from London Business School and worked for many years as a data analyst before making the transition from creator to coach.

Matthias Giger

View Profile

Matthias Giger

Greater Zurich Area, Switzerland
Matthias is a BI consultant for Business & Decision Switzerland. He works in different areas (financial services, tourism, ITSM, etc.), which suits him very well as he worked as a journalist for many years. Matthias solves problems with critical thinking and uses creative approaches. As a former librarian, he loves helping others with their challenges with Tableau Desktop, Tableau Server, Tableau Cloud, Tableau Prep Builder, data visualization and automation. For him, it's the best way to gain experience and apply knowledge. Outside of work, he enjoys going fly fishing when he can find a window of time.

Matz Rasmus

View Profile

Matz Rasmus

Espoo, Finland
I began my data journey in 2014 productizing analytics for my company using Tableau. After that I have been a part of #datafam, and starting from 2019, I am working full time as Tableau consultant focusing on the server and any scripting around the server. I try to keep up with the latest development by testing beta releases, and participating in prerelease testing whenever possible. My strongest Tableau memory is from my first TC back in 2015, when the entire arena with 11.000+ attendees gave standing ovations when Developers On Stage presented "Cross Database Joins" - that is when I realized that the Tableau users are really something special. When I am not prowling the Tableau Forums for new information, or someone I can help, I like to be out on, or by the sea. I am a 3rd year Tableau Forums Ambassador

Mavis Liu

View Profile

Mavis Liu

London, United Kingdom
Mavis has always enjoyed being creative and has a particular interest in painting and interior design. She quickly realised that she could use these skills in Tableau to continue exploring her creativity. She loves that she can use Tableau and make something engaging so that people are interested in visualising their data. As an accredited Tableau Trainer for a number of years, she loves teaching people how to use Tableau. Naturally the Tableau Forums is somewhere where she enjoys contributing!

Megha Narang

View Profile

Megha Narang

Mumbai, India
My name is Megha Narang and I am a Business Intelligence Lead at Blend360. I have accumulated over a decade of experience in consulting, research and analysis space in various industries. Recognizing the need for additional expertise in the field of data visualization tools, I made the decision to specialize in BI in 2020 and successfully obtained certifications as a Tableau and Alteryx professional. I enjoy assisting my colleagues and Tableau forum users with their real-time questions and concerns. To continuously improve my skills, I actively seek opportunities to participate in challenges like #workoutwednesday and publish personal vizzes to Tableau Public. During my spare time, I share Tableau tips, tricks and design best practices on my YouTube channel.

Michael Hesser

View Profile

Michael Hesser

Ypsilanti, United States of America
Michael Hesser is a Solution Architect and Tableau Consultant, with over a decade of experience in Healthcare Analytics. Michael has worked with internal and external clients of IBM and, most recently, the Estee Lauder Companies. He's a dedicated problem-solver and enjoys finding creative solutions to complex problems.

Mike Manning

View Profile

Mike Manning

Boston, United States of America
I'm currently a business analyst with 6 years of experience using Tableau. Professionally, my two major passions are great design and process improvement. Naturally, Tableau was a great fit! I can connect users with the information they need and design the dashboard to be easy to understand and draw insights from. You'll often see me in the Ideas section of the forums, and hopefully, you'll see some of my blogs soon, as I work to share some tips and opinions with the community. Outside the office, I love to learn and try new things, whether traveling to a new country, picking up a new skill, or testing out a new hot sauce recipe!

Peiyun (Sherry) Shen

View Profile

Peiyun (Sherry) Shen

College Park, Maryland, United States of America
Sherry Shen is a Business Intelligence Manager at Blend360. Her professional experience includes working for a wide range of organizations -- from small non-profits to Fortune 500 companies -- in marketing, finance, and, most recently, healthcare. She is a certified Tableau Desktop Professional and has been invited to speak at multiple TUGs/workshops about design best practices. Sherry loves to tackle calculation problems for her co-workers and the users at the Tableau forum. She also enjoys exploring her creativity inside Tableau and creating fun visuals on the Tableau Public during her spare time.

Peter Fakan

View Profile

Peter Fakan

Canberra, Australia
Peter has a passion for translating data into actionable insights and fostering data-driven decision-making. Peter is an accomplished business analyst and Tableau developer with an extensive track record of revolutionizing reporting landscapes within the Australian Federal Government. Peter has also been a Tableau Forums Ambassador since 2019. Peters forums journey started much like any other reader – coming to the forums and asking questions. After a period of time this changed to offering advice, and then onto Forums Ambassador. Alongside this journey, Peter continued pushing the boundaries of conventional reporting practices in Federal Government, often being the catalyst for change, spearheading the deployment and construction of Tableau products aligned with the stringent data standards set by the Australian Government. By adhering to principles such as web content accessibility and print publishing standards, Peter not only met regulatory requirements but also elevated the quality of government reporting to a level of industry best practice. Central to this has been the transformation of entrenched and often outdated reporting. Peter embraced the challenge of transitioning government departments from archaic reporting tools like Excel and Access to the dynamic world of Tableau. In these scenarios, Peter not only revamped reporting environments from scratch but also galvanized entire teams to embrace a data-driven culture. This process is often characterized by bridging the gap between ICT infrastructure and business areas. Peters ability to revolutionize reporting extends beyond technical proficiency. Peter thrives on challenging rusted on norms and putting the work in to deliver superior solutions. Through education and training initiatives, Peter has empowered business units to unearth hidden insights within their data and embrace data literacy, often with firsthand experience of the transformation of managers and executives as they transition from being passive recipients of data to enthusiastic data explorers, enabling them to make informed strategic decisions rather than managing the status quo. Peters expertise is rooted in an extensive background in business intelligence, data warehousing, and reporting. Over the course of more than two decades, Peter has garnered invaluable experience within various government programs and IT roles. This comprehensive perspective has equipped Peter with a unique vantage point to understand the intricate needs and challenges faced by different Government departments. Throughout Peters career, he has left an indelible mark on organizations through his contributions. As a Tableau Developer at the Department of Veterans’ Affairs and the Department of Defence, Peter played a pivotal role in enhancing Data Visualisation and HR Data Warehouse capabilities. Peters long tenure at the Australian Institute of Health and Welfare saw him orchestrating Tableau rollouts, facilitating user group sessions, and championing the release of new versions. Peters journey from a career serviceman and now veteran in both the Australian and New Zealand Regular Armies to a trailblazing Tableau practitioner has been guided by an unyielding commitment to innovation and transformation. Peters vision for the future is one where data is democratically accessible and empowers decision-makers at all levels. Peter remains resolute in his endeavor to reshape reporting landscapes, foster data literacy, and unlock the full potential of data as a strategic asset. Based in Canberra, Australia's capital city, Peter continues to orchestrate profound transformations within the government reporting sphere. Peters ability to seamlessly meld technical expertise with strategic foresight makes him a sought-after partner in propelling organizations into a data-centric era. Peter is unwavering in his mission to ignite enthusiasm for data, catalyze change, and enable organizations to harness the power of information in their pursuit of excellence.

Rajavel Selvaraj Ganesan

View Profile

Rajavel Selvaraj Ganesan

New Albany, United States of America
Rajavel is a Business Intelligence & Solutions Architect. He has a unique blend of product management and "hands-on" experience in data warehousing, reporting, visualization, and advanced analytics. In addition to keeping a constant pulse on industry trends, he enjoys delving into oceans of data to solve complex problems with business intelligence tools (such as MicroStrategy, Tableau, Power BI, Qlik or Business Objects or etc) & machine learning. He loves the Tableau community a lot for the amount of positivity they spread to the global community. He has worked on App development (Android, iOS) for business users using BI tools.

Said Tojiboev

View Profile

Said Tojiboev

Tashkent, Uzbekistan
Said Tojiboev is a data analytics professional with a bachelor's degree from Tashkent State Technical University and an MBA from Ulsan. Having worked for leading companies in South Korea, he skillfully employed his proficiency in Tableau to unlock valuable insights from complex data sets. His commitment to data-driven decision-making processes helped businesses thrive in a competitive landscape. Currently a government official in Uzbekistan, Said focuses on the education sector by actively contributing to the enhancement of data literacy using Tableau to empower educators, students, and institutions alike.

Santhosh Sekar

View Profile

Santhosh Sekar

Mundelein, United States of America
Meet Santhosh Sekar, a versatile Tableau enthusiast and a seasoned solution architect with a remarkable journey spanning over 7 years in Tableau Server and Desktop expertise. Within the organization, Santhosh has earned the esteemed title of a Tableau expert, steering the administration of multiple Tableau Server environments and providing invaluable internal consultation while championing best practices to empower colleagues across the business. Achievement includes Tableau Desktop Specialist, Certified Consultant, and Server Certified Associate. His dedication to the field has established him as a stalwart figure, consistently pushing the boundaries of what's possible with Tableau.

Seowoo Chang

View Profile

Seowoo Chang

Seoul, South Korea
Seowoo is a Tableau Engineer at Woongjin, a Tableau Partner in South Korea. He is also a Ph.D. student at Hongik University, where he is researching visual attentions. Seowoo is passionate about helping people understand data more easily, and he has created a Tableau course for Korean users on Udemy. He also has a blog and YouTube channel called "1 minute Tableau," where he shares information and tips about Tableau. Seowoo speaks Korean, English, and Japanese.

Sergiu Rotaru

View Profile

Sergiu Rotaru

Cluj-Napoca, Romania
I was born in the Republic of Moldova, now living in Cluj-Napoca, Romania, with my wife, daughter, and our Labrador. My life changed in 2017 when I discovered Tableau. Since then, I have become passionate about data analytics, helping people understand data, bringing people together, and building community. My certifications are: Tableau Certified Associate Consultant, Tableau Desktop Certified Associate, Tableau Desktop Specialist. My mission is to improve data visualization literacy in Romania. I am doing this through my current roles: Data Analytics Consultant - Freelancer, Initiator and Co-Leader at #RomanianDATATribe (Romania's biggest data visualization community).

Shuhei Saito

View Profile

Shuhei Saito

Fukuoka, Japan
I'm a section manager of sales analytics department for a retail company in Japan. Using Tableau Desktop and Tableau Cloud from 2016, I have been a member of Community Forum Ambassador from 2019. I especially love to use Table Calculation and create Maps.

Steffen Volkerding

View Profile

Steffen Volkerding

Germany
Steffen currently works with global real estate brokerage firm Engel & Völkers in their Hamburg, Germany, based headquarter where he leads the business intelligence finance and market insights division. Within the world of data his expertise is in using Tableau (Desktop mostly), SQL and a dash of Javascript. Coming from a classical finance background Steffen made his way into data and data analytics starting 2019 and since has tried his best to learn new skills whilst keeping close contact to his previous roles in controlling and finance management, thus becoming a "bridge" between the two worlds. He loves heavy metal and martial arts and whenever the time allows will post on his blog at tableauadventurer.com

Steve Martin

View Profile

Steve Martin

Northampton, United Kingdom
Steve loves to help others solve their problems, particularly complex ones, and whilst he can be found helping out over at StackExchange, Reddit and Qlik, he spends nearly all his time within the Tableau Community. Data has always been a real passion for him, and as both an SQL engineer and analyst, he is always able to satisfy his passions: Investigating, building (data warehouses), transforming, modeling, mining, performance optimisation and analytics; though it wasn’t until late 2008, when he built his first Tableau dashboard, that he was able to see just how powerful interactive analytics could be. Steve builds as dynamic as possible, which usually means parameters, window calcs and CustomSQL and hardly any [distracting] filters.

Steve Wood

View Profile

Steve Wood

Dunedin, New Zealand
Steve is Head of Data & Analytics for an NZ finance company. Originally from the UK, he took a year out to travel the world and never returned. A background in software lead to BI and data before he was thrown into human centered design. Customer research was a defining experience, leaving Steve passionate about the value of blending qualitative and quantitative insights. Tableau became a data exploration weapon of choice when the CEO asked for “more maps!” and the Tableau community were fuel for the fire. Out of work you'll find Steve hiking a new trail or tackling tough Tableau problems on the forum. Either way it's about exploration and discovery, so if Steve can help with your Tableau journey, drop him a line.

Sunny Kasa

View Profile

Sunny Kasa

Bhaktapur, Nepal
Sunny Kasalawat is a Software Engineer based in Nepal and working at LIS Nepal. He specializes in projects involving retail reporting, customer insights, and warehouse optimization. A data visualization enthusiast, he excels in translating complex information into intuitive visuals, enhancing decision-making processes. Focusing on improving retail operations through data-driven solutions, he drives innovation while creating user-friendly platforms. His collaborative and communicative approach fosters effective teamwork and stakeholder engagement, solidifying his role as a driving force in software engineering.

Tadd Wagner

View Profile

Tadd Wagner

Carthage, United States of America
With a decade of experience in Business Intelligence, Tadd Wagner stands as a seasoned professional in the healthcare and pharmaceutical industries. A devoted data enthusiast, Tadd first came across Tableau seven years ago and was immediately hooked. Holding an undergraduate degree in Applied Mathematics from Trevecca Nazarene University, he is currently pursuing an MS in Analytics at Georgia Tech. Tadd currently thrives as a key contributor to the Conversational AI program at CVS Health (Aetna). In this role, he develops sophisticated reporting and analytics dashboards that focus on critical Key Performance Indicators (KPIs) and help identify opportunities for improving member experience. Beyond the realm of data, he enjoys getting outside for hikes and fishing trips with his wife and four kids. When it's game day, you can find Tadd with an elevated heart rate watching the Kansas City Chiefs. When it’s not game day, you might find him drinking black coffee while reading theological literature. Otherwise, catch him on the Forums where he hopes to continue learning more about Tableau and sharing what he has already learned so far.

Tatyana Nikolova

View Profile

Tatyana Nikolova

Poole, United Kingdom
Tatyana is a problem solver and enjoys finding creative solutions to challenging problems. In her work with Tableau, she trusts the smart features of the software to aid her analysis. Tatyana likes to answer questions regarding Tableau Desktop on how to produce a view from a concept applying design thinking, how to solve an existing visualisation issue and data storytelling. She has work experience in creating data insights and reporting in various industries - from energy through publishing & media to telecommunications. The Forums are the place where she enjoys helping the global community and collaborating on a variety of projects. She volunteers her time and expertise to inspire students to dig data and consider this vertical as a future career path.

Veronica Simoes

View Profile

Veronica Simoes

Rio de Janeiro, Brazil
Veronica Simoes has over 18 years of experience in Business Intelligence, Data Management, Big Data and DataVisualisation. She started her journey with the Tableau community in 2011 as a volunteer, analyzing data related to anonymous reports of violence in Rio de Janeiro. She also have founded TUGs Rio de Janeiro, Sao Paulo and Fortaleza and started this great challenge of bringing customers and data analytics professionals who didn't know Tableau. Veronica is the Founder of PATH https://www.path.com.br and provides basic and advanced tips and tricks for those who want to improve their Tableau Technical skills https://path.com.br/tableau-dicas-e-truques/. Veronica is also Tableau Visionary/Tableau Forum Ambassador and loves to share her deep knowledge with Tableau Community.

Vishwarath Nagaraju

View Profile

Vishwarath Nagaraju

New Jersey, United States of America
Vish graduated in Masters of Computer Science from London and has been working as a Senior Consultant in Data Analytics over a decade using niche Business Intelligence tools working in Microsoft Report Suite, Qlikview/Qliksense and Tableau. He enjoys helping people and volunteers on tableau community answering complex data and reporting issues posted on the community forums that in turn helps to learn new ways to resolve problems. In leisure, he would love to spend time with the family and love to travel places. Regular fitness is his top priority to rejuvenate his day.

Viviane Lefebvre

View Profile

Viviane Lefebvre

Nancy, France
Viviane currently works as a Data Scientist Consultant with the accounting, audit, and consulting firm Batt in France. She got both a Master in Management and a MicroMaster in Statistics and Data Science, a great combination to understand the needs of clients and the demands of data analytics. She has been using Tableau and Python for 2 years now and keeps on learning new tips and tricks to share with her team, and people around the world through the Tableau Community Forum. Her hobbies? Travelling and rugby.

Liu Yi

View Profile

Liu Yi

I have been engaged in supply chain and commercial retail for decades. I always like relevant data collection and analysis, auxiliary management and decision-making. It's amazing to start contacting tableau in 2019! It solves many problems that can not be solved by many tools and software in the past. From basic data cleaning to the interactive display and commercial application of the final dashboard, it realizes a complete closed-loop tool for business management, and has great potential. I personally like the knowledge and tools related to data science. There are many in the market, from Python and R of programming language, basic office access and excel, to database visualization, and then to visual Bi represented by tableau; Each has its own strengths, but tableau is the most promising In tableau forum, I hope to get to know more data fans and enjoy the clear data insight and visual impact it brings. It's a very happy thing.

Yuliya Chepurnaya

View Profile

Yuliya Chepurnaya

Minsk, Belarus
I am a BI Developer at Vizuators. My love for data, charts, formulas and order in everything woke up during the university. I graduated from the Belarusian State University as a mathematician-programmer. At first, I was engaged in precise sciences: I spoke at conferences, wrote and published scientific articles about mathematical modeling of physical processes. Then, wanting to realize the aforementioned love, I decided to try myself as a BI Developer. Tableau products and my colleagues help me to realize all my favorite aspects: development and design of dashboards, working with data, consulting clients, training, and so on. Together with the team, we are making the world of big data clearer and better.

Yuri Fal

View Profile

Yuri Fal

Moscow, Russia
Made my first breath 58 years ago (still breathing). Had a degree in Microbiology from Moscow State University. Met my wife there and fell in love from the first sight. Learned computers & internet in early 90th. Had been involved in several businesses (with friends & co-eds). Joined the ANALYTIKA PLUS team in 2014 as a Data Analyst. Met Tableau (Desktop) in 2007 and fell in love from the first sight. Jumped to Tableau Forums in 2014 (and continue jumping). Joined the cohort of Community Forum Ambassadors in 2016.

Zach Leber

View Profile

Zach Leber

Boston, United States of America
Zach has been a Tableau evangelist since 2010. As director of analytics for the world's largest DNA sequencing center, he created Tableau data visualizations of lab and project operations including a real-time laboratory sample tracking dashboard. Zach was the co-chair of the Boston Tableau User Group from 2011 to 2019, hosting, organizing, and speaking at dozens of meetings. In his current role at a medical device company, Zach uses Tableau to map service and sales data for trip and territory optimization, as well as analyze cloud treatment data from neurostimulation machines.

Social Ambassadors

Social Ambassadors are inclusive leaders who go above and beyond to drive thought-provoking conversations about data, champion others, welcome people to the community, and amplify key messages across all social channels.


Adam Mico

View Profile

Adam Mico

Boston Area, United States of America
Adam Mico is a renowned leader in Data Visualization Enablement and Fluency. Recognized as a 2x Tableau Visionary and 4x Tableau Ambassador, Adam's expertise in data visualization is widely acknowledged. He serves as an Advisory Board Member for the Data Leadership Collaborative and is a recipient of the prestigious Golden Hoodie at #DF22. As the founder of #TableauNext, he continues to drive innovation in the field. Adam is also a member of the Tableau Speaker Bureau and a published author with Packt Publishing.

Alice McKnight

View Profile

Alice McKnight

Lawrenceville, United States of America
Alice McKnight is a Senior Consultant with phData. She collaborates with clients to create clear, engaging, and informative data products that provide insight into complex business problems. When she's not creating vizzes she spends time with her family, attending live music events, sipping on craft beer, and catching up on television and movies.

Allison Wright

View Profile

Allison Wright

Philadelphia, United States of America
Allison joined the Tableau community in 2020 via Millennials and Data (#MAD4) as a newbie and a career changer. With continued support from the #DataFam, Allison is now a senior BI analyst at JLL and a co-moderator for "Women in Dataviz". Outside of making connections and learning about new data-related topics, Allison enjoys coffee, cooking/baking and going to concerts.

Andrés Quiroz Sánchez

View Profile

Andrés Quiroz Sánchez

Macul, Santiago de Chile, Chile
Andrés Quiroz, Analista de Control de Gestión en la CGR. Ingeniero Comercial especializado en informes, indicadores y Dashboards mediante Tableau y SQL Server. Experto en modelos de negocio, fomenta la colaboración interna y externa. Aficionado a películas, asados con Queency (su perrita) y coleccionar camisetas de fútbol.

Ann Pregler

View Profile

Ann Pregler

Battle Ground, United States of America
Ann Pregler is a Tableau Developer at Starschema. She has a background in K-12 education, and is passionate about using Tableau to explore and explain ideas. Getting involved in the supportive Tableau community accelerated her skill development and personal growth. Now she loves helping others level up through social media and her blog, while still constantly learning new things from the #DataFam! When not wrangling data or spending time with family, she can usually be found gardening, crafting, or baking.

Annabelle Rincon

View Profile

Annabelle Rincon

Zurich, Switzerland
After having led successfully team of data experts of different sizes and locations for the past fifteen years, Annabelle is currently leading the Tableau Center of Enablement at Vontobel, where she uses her skills and passion to drive Visual Best Practices adoption in her company. She considers data visualization and analytics her ikigai (purpose) and enjoys fostering a community of practitioners in every organization she works. Annabelle is specialized in Visuals Analytics and mastering Tableau (both Desktop and Server). She holds a Tableau Desktop Certified Professional certification and was recognized as a Tableau Visionary and Social Media Ambassador. In her free time, she co-leads Data + Women Zurich and the Tableau Analytics User Group.

Annie Nelson

View Profile

Annie Nelson

NYC, United States of America
I am a data analyst on the Enterprise Data Team at GitLab. In 2022 I finished my masters degree in occupational therapy and left my job as a nanny so I could (surprise!) become a data analyst. I documented my entire journey - learning, job searching, and working at my first job as a Tableau Consultant for a year on my Tik Tok and LinkedIn pages. I love to help others learn through tips, advice, and sharing my story. In my free time I continue to talk about data online, and I rock climb, and travel the world!

Ansula Jain

View Profile

Ansula Jain

Bengaluru, India
My Name is Ansula Jain, and I have been working in the data field for close to a decade, I am backed up Data experience from multiple domains and spheres of life, I specialise in generating compelling Tableau dashboards that power my stakeholders with insights and help them take Data driven business decisions. I own a Youtube channel (Techi Anshi) where I regularly share tips and tricks that I have learnt over these years that can help my community grow and learn!! Join my Network so we can Talk Data!!

Autumn Battani

View Profile

Autumn Battani

Macomb, United States of America
Autumn Battani is a Senior Principal Consultant at phData where she delivers data visualization solutions to enterprise clients. She enjoys traveling and all things entertainment which aided her during her time supporting The Walt Disney Company's analytics efforts. She is a Tableau Visionary, 7 time Viz of the Day winner, and recipient of the Michael W. Chrisiani Community Leadership Award and Best Content Creator at the 2022 vizzies. She's also passionate about promoting issues of equity, awareness, and inclusion and advocates for them through the community initiative she co-leads, Diversity in Data. When practicing data visualization, she focuses on efficient reporting methodologies with high quality user interfaces to help bring non-data stakeholders closer to insights more quickly.

Branden Kornell

View Profile

Branden Kornell

Boston, MA, United States of America
Branden has been working in analytics for 20 years has specialized in Tableau since 2012. He’s a Tableau Certified Data Analyst, a regular participant and presenter at TUGs, a Tableau teacher, and a #datafam member eager to discuss industry topics like career transitions, artificial intelligence, DEI, and accessibility. He’s worked in fields as diverse as international health, travel, insurance, and media. In 2022, he and scientist Simona Gokhin launched BKSG Consulting, a boutique analytics firm specializing in the pharmaceutical, biotech, and healthcare industries. He holds an B.A. in Psychology from Brandeis University and an M.B.A. from Boston University.

Carl Allchin

View Profile

Carl Allchin

London, United Kingdom
Carl is the Head Coach at The Data School in the UK, a published author on data and co-founder of Preppin' Data. He's used Tableau for over ten years now and enjoys teaching others to get the most out of their skills by using the platform.

Caroline Swiger

View Profile

Caroline Swiger

Greenville, South Carolina, United States of America
Caroline is a Senior Manager of Analytics & Insights at TD Bank where she specializes in transforming model results into insightful visual stories using Tableau. The Tableau Community and #datafam have played an integral role in developing her creative skills over the last five years to accompany her quantitative skill set. She is an avid #WorkoutWednesday participant, loves #Back2VizBasics, and is here for all the gifs, emojis, tips, and #digthisviz hashtag action on Twitter.

Cesar Picco

View Profile

Cesar Picco

Herndon, VA, United States of America
In the dynamic realm of Business Intelligence, Cesar stands as a seasoned professional with over 17 years of experience. His journey took an unexpected turn when he discovered Tableau, a tool that revolutionized his approach to solving customer problems and gaining insights. With Tableau in his toolkit, Cesar embarked on a mission to streamline processes and automate data management at T-Mobile. Beyond his professional pursuits, Cesar, a father of three, finds solace in spending quality time with his family. When not immersed in data projects, he dives into a rather electrifying hobby—rehabbing vintage guitar amplifiers and crafting custom guitar pedals. But Cesar's commitment extends further; he actively contributes to his local makerspace, offering his expertise to those exploring Raspberry Pi and Arduino projects, embodying a passion for innovation and community engagement that transcends his own endeavors.

Christina Gorga

View Profile

Christina Gorga

Ashburn, United States of America
Christina Gorga is a data strategist and enablement lead based in Northern Virginia. She found her way into data visualization via her past work experience in cognitive science and education research. Christina advocates for individuals switching careers into data, especially working mothers through the #MomsWhoViz community and the Career Path Makers transition program launched in 2023. She was the 2018 Michael Cristiani Community Founders Award winner. She is the co-founder and co-lead of the monthly #DataFamCon community challenge which celebrates pop culture data. At the core of her beliefs is that diversity in backgrounds and education enhances the data visualization field, and in turn, increases public awareness for science and critical social issues. In her spare time, she enjoys consuming science fiction in all media formats, golfing, mid-century design, and collecting vinyl.

Danny Bradley

View Profile

Danny Bradley

Stockton-On-Tees, United Kingdom
Danny Bradley is the Lead Business Intelligence Analyst at Integral UK (part of the JLL family) and has worked in data for over 12 years. Danny is passionate about data visualisation, data engineering, data strategies and leadership. He regularly seeks new ways to visualise data to answer business questions effectively and passes that knowledge on to his team. He co-leads the North East, UK, Tableau User Group and you’ll find him regularly writing about his data experiences on X (Twitter). Danny is a British data awards winner, Tableau Featured Author and has spoken at numerous data events in the last few years. You can follow Danny on X (Twitter) by using searching @vizwithdan.

Darragh Murray

View Profile

Darragh Murray

Brisbane, Australia
Darragh Murray is the Senior Analytics and Insights Specialist at Powerlink Queensland, working alongside a dedicated team of Tableau and analytics specialists to build a world-class energy future. Darragh dedicates himself to uplifting business and institutional performance through the expert use of data and analytics. Presently, Darragh works in the Australian energy sector, using his skills to assist in the transition to a low-carbon future. A Tableau user and advocate since 2016, Darragh has been a multiple Viz of the Day recipient and was fortunate enough to place in the top 15 competitors in the 2023 IronViz competition. He regularly blogs on the subjects of analytics, the evolution of the data professional, and Tableau tips and techniques. Darragh is passionate about the role of data in providing clarity about the world in which we live, as well as uplifting the data skills of colleagues, friends and members of the #datafam. When he's not building charts, Darragh enjoys music (both listening and playing), cycling, programming in R, watching Australian Rules Footy and hanging out with his young son.

Dawn Harrington

View Profile

Dawn Harrington

West Chester, United States of America
Dawn Harrington is a Tableau Software Engineer VP at JP Morgan Chase & Co. She has her own blog site Techtipsgirl.com where she writes how-to articles covering a variety of topics for Tableau, Alteryx and Microsoft Office. She is also an Alteryx Innovator. She currently has two degrees, a BFA in Art Education and a Computer Applications degree. Her personal and professional goals are to help educate as many users as she can through her tech tips. She hosts many training sessions at her company and has volunteered to host / present at many TUG sessions. Her blog articles have been featured for the Datafam round up articles and in TableauBites. She loves all things scifi including Dr. Who, Marvel, Star Trek and Star Wars.

Deborah Simmonds

View Profile

Deborah Simmonds

Hull, United Kingdom
Discovering Tableau completely changed my life. My success changing careers in my late 40s can be directly attributed to the generosity of support, training, and encouragement that I have received via the DataFam, who continue to inspire me daily. I have been working for Integral UK Ltd as a Senior BI Analyst since January 2022, and I am keen to pay forwards the support I have received to help others develop the skills that they need to make their own career transitions.

Dinushki De Livera

View Profile

Dinushki De Livera

Cincinnati, OH, United States of America
Dinushki is a Business Analyst on the Business Intelligence team at Unifund and Recovery Decision Science. She first fell in love with Tableau at a data visualization class during her Master and has now been using Tableau for about 7 years. She won the 2018 Women in Analytics Data Visualization Contest and was awarded the 2019 Viz of the Year by The Tableau Wannabe Podcast at the 2019 Tableau Conference. Her Firebird Visualization was on the Shortlist for the 2019 Kantar Information is Beautiful Awards. Dinushki is also the co-founder of Her Data and a Tableau User Group Leader in Cincinnati.

Dustin Schimek

View Profile

Dustin Schimek

Milwaukee, United States of America
Dustin Schimek is Product Manager for Wiiisdom Ops for Tableau. Since being introduced to Tableau in 2013, he developed a passion for leading analytics initiatives that drive positive change and helping others develop their careers in the field. He can be spotted carrying out these passions while co-hosting the Data Careers Summit, hosting the Data Ideas podcast and speaking at various industry events (including TC 2019 and 2023). Dustin is a proud resident of Milwaukee, Wisconsin, where he enjoys cheering on local sports teams and spending time with his wife and two children.

Dzifa Amexo

View Profile

Dzifa Amexo

New York, United States of America
Dzifa is all about data, lifestyle, and laughs! She is passionate about helping people discover the power of visualizing data, storytelling, and Tableau. As a co-leader of the BLK in D&A, Financial Services, and NYC Tableau User Groups she is dedicated to creating supportive and welcoming communities where individuals can come together to learn and network. She is eager to welcome and encourage all, especially people of color and women to get involved in the community and start on their data journey! Currently, she is a Data Technology Consultant at Keyrus. Outside of Tableau and work, Dzifa enjoys karaoke, traveling, volunteering, rollerblading, reading, and eating her way through the NYC food scene!

Erica Hughes

View Profile

Erica Hughes

New York, United States of America
Erica has been working with Tableau for 3 years, and for half of that time has been a contributing member of the WorkoutWednesday coaching team. At recent Tableau Conferences she has hosted WorkoutWednesday workshops as well as presenting a 40-min session on debugging Tableau error messages and unpicking complex calculations to help you validate your data. You will find summaries of these sessions on her Tableau Public profile as well as a deep dive into how to configure Table Calculations. Erica is passionate about demystifying complex concepts and finding simple ways to share them with a wider audience.

Eve Thomas

View Profile

Eve Thomas

London, United Kingdom
I am a London-based Commercial Finance Analytics Manager working at Sainsburys. I am passionate about education & love to create visualizations that make data fun for users of all ages. I am also passionate about promoting accessibility & try to bring this into my everyday role. I co-lead two community initiatives, #DiversityinData, an initiative centred around diversity, equity & awareness, & #Viz2Educate, an initiative focused on creating a high-quality bank of free educational resources for teachers worldwide. In my spare time I enjoy travel, running, reading, and exploring London's museums & galleries. I also love to find new and exciting restaurants, and trying new cuisines.

Felicia Styer

View Profile

Felicia Styer

Kansas City, United States of America
Felicia has been using Tableau since 2016, and loves pushing the limits of what can be done with it. She can't resist a good puzzle. Currently she’s on a quest to answer 365 Tableau questions over 2023 with her project #Tableau365. Outside of work, her other hobbies include board games, logic puzzles, and nature walks. Felicia lives in Kanas City, and is Associate Director of Analytics Solutions for Playfair Data.

Gurpreet Singh

View Profile

Gurpreet Singh

Kariong, Australia
Gurpreet Singh is Reporting & Insights lead, certified tableau desktop specialist , tableau trainer and analytics content creator with 16+ years of experience in Information Technology. His journey with Data Analytics & Visualisation started back in 2009 when he did Masters in Information System and never looked back. The power of data and how it assist humans to make decisions led him to explore his interest in Data Analytics & Visualisation. He was introduced to tableau in 2016 which brought in the creative element along with his data journey, since then, he continued learning new techniques and shares his learning with the tableau community through his YouTube channel - Data Viz Canvas. He is most passionate about finding innovative ways to present data stories that are visually appealing, highly informative and engaging. He enjoys working with complex data to make it look simple and insightful. He spends a lot of his time creating tutorials on tableau tips & tricks, new techniques and artistic ways of visualising data. Along with that he also gets involved with tableau community in answering their queries and participates in discussions on social media as he believes in empowering others. Outside of work and data visualisation, Gurpreet loves to spend time with his two kids who keep him busy. If he gets a chance juggling all the other things then he loves to spend the rest of his time doing gardening and painting.

Hiroyoshi Kamegaki

View Profile

Hiroyoshi Kamegaki

Fujisawa, Japan
Worked for a city gas company, in charge of accounting DX in the accounting department I have been with Tableau for 6 years. Certified as DATASaber from February 2023 Leader of Japanese infrastructure company user group Host data classes for high school and elementary school students

Jack Hineman

View Profile

Jack Hineman

Indianapolis, IN, United States of America
Jack Hineman is the VP of Business Intelligence at Gaylor Electric. After starting his career in IT, he pivoted to BI in 2017 with a mission to empower measurement-focused accountability to remove emotion from the decision-making process. Jack has been recognized as a leader in analytics for the Construction Industry and has presented at several industry conferences including TC21. He is a Tableau Social Ambassador, Co-Lead of the Architecture, Engineering, & Construction TUG (AECTUG), and an active participant in Tableau community challenges. After work, he enjoys spending time with his amazing wife (Amy) and their 3 boys (Cooper, Asher, & Lincoln), coaching football & basketball, and traveling.

Jacqui Moore

View Profile

Jacqui Moore

Greater Boston, United States of America
Jacqui Moore is a Data Visualization & Analytics Practice Technical Lead at Cleartelligence with over ten years of experience in analytics. As a consultant, she is passionate about creating data solutions that are helpful, enjoyable, and easy to use. Jacqui enjoys working with the data and engineering data sets that work well with Tableau, and loves to support and enable others in their data and Tableau journey. She is co-lead of the Boston Tableau User Group and #RWFD (Real World, Fake Data). She is also a #MomsWhoViz, an artist, and blogs with her husband at DoMooreWithData.com.

Jade Corley

View Profile

Jade Corley

Greenville, United States of America
Hi :) I'm Jade and I have been using Tableau since 2017 where my initial journey sparked. I spent a few years working in Tableau in the finance and operations office at Clemson University. Today, I am a Solutions Architect at Analytic Vizion, a consulting firm where I get to work across multiple industries from healthcare, to subscription, to real estate, to finance, and more. I enjoy engaging with the #datafam, sharing tips I learn to my blog, and transforming the presumably dull aspects of data one visualization at a time. I'm from Greenville SC, where when I'm not working in Tableau, I'm hiking and exploring the blue ridge mountains, volunteering at our local food pantry, or grabbing tacos with friends. I am honored to be an ambassador, where I can't wait to meet more of the community and hopefully inspire others to try out Tableau and see where it takes them.

Jared Flores

View Profile

Jared Flores

Arlington, United States of America
Jared Flores, a prominent Consulting Leader at Analytic Vizion, is passionate about Tableau Prep—demonstrated by his 100-day #PreppinData challenge. Recognized as the 2022 Tableau Vizzie Awards' PrepStar, he credits the DataFam for sparking his initiative. Jared shares his expertise on his YouTube channel, "Put Some Prep In Your Step," aiming to empower others with Tableau skills. His dedication to education shines as a Tableau Instructor at Emory University, where he collaborates with Women In Technology to enable single mothers to excel in IT careers.

Jenny Martin

View Profile

Jenny Martin

Southend-on-Sea, United Kingdom
When Jenny first found Tableau 4 and a half years ago, she immediately wanted to use it to build a Pokédex, which is still one of the projects she's most proud of today. Discovering Tableau Prep a couple of months later opened up a whole new world of possibilities and soon enough she was encouraging others to prepare Pokémon data through Preppin' Data challenges. It's one of her favourite things to geek out with people taking their first steps with the tool. She also helps to run the Tableau Prep User Group, which is a great way to share in the excitement about Tableau around the world!

KT

Tokyo, Japan
My life was totally changed when I met Tableau. Since I was inspired by Tableau's belief people are born with creativity, I have been working to spread data-driven culture. I'm the founder of the #DATASaber program which is a community-driven program that fosters people who promote a data-driven culture and activates the community. 1500+ people are graduated #DATASaber and they drive and evangelize what is the data driven in their organization and in the public. Also I'm in the leadership team in Japan Tableau User Group #JTUG which is the largest TUG in Japan. We connect Tableau users by organizing flagship events that attract hundreds of people once a year and also publishing online contents (web, X(Twitter), etc.).

Lawrence Durbin

View Profile

Lawrence Durbin

Longmont, United States of America
Lawrence (He/Him/His) is a Senior People Analyst, DEI Advocate, and co-lead of multiple Tableau Community initiatives. While having started utilizing Tableau in 2018 his career in data started over 10 years ago and his experience includes an array of data including technical support, People/HR, Learning & Development, DEI, and more. Additionally, Lawrence focuses on engaging data, AI/ML, & leadership teams on understanding inherent biases in their systems. All this driven by a core belief that groups, teams, and cultures that have multiple diverse perspectives and provide the safety for its members to be vulnerable will create the best solutions for any of the problems faced today.

Ligia Galvão

View Profile

Ligia Galvão

São Paulo, Brazil
Ligia Galvão is an Analytics Manager at Colgate company in Brazil and a co-leader of Data + Women Latam and Tableau Brazil Community. She is a powerful force in the community and uses her positive attitude and tireless energy to encourage other women to work in male-dominated data areas. Also, Ligia is a Master's in Customer Intelligence and Analytics and spends her free time teaching Tableau and analytics skills through her LinkedIn Learning courses, courses at universities, and the ‘Jornada Nacional Tableau’ event. Ligia is inspired daily by her husband who is an analytics leader as well.

Lisa Trescott

View Profile

Lisa Trescott

Carlsbad, California, United States of America
Lisa Trescott is a research analyst at MiraCosta College, where she supports the efforts of the college’s student equity and achievement programs. In her role, Lisa uses Tableau to examine student outcomes, help identify students in need, and assist the college with strategic planning. She has been using Tableau since 2017, and was the Iron Viz Global Champion in 2021, won the Tableau Tip Battle at TC23, and currently co-leads the California Community Colleges Tableau User Group. When not playing with data, you can find Lisa at the beach, hiking, or chasing after her very active toddler.

Matt Francis

View Profile

Matt Francis

Bishops Stortford, United Kingdom
By day he works at one of the world's largest DNA sequencing labs, creating dashboards that enable the DNA sequencing pipelines to keep track of millions of DNA samples Since installing Tableau 10 years ago, he has become a champion for Tableau within the institute and loves to share the good news of data viz to anyone who will listen. He is heavily engaged in the Tableau community through his blog, www.mattsworldofviz.com, and spends hours on Twitter monitoring the #datafam and #tableau channels. He is a co-founder of The Tableau Community Awards, The Vizzies and is a regular speaker at conference, known for his enormous slide decks and sense of humour.

momo

Tokyo, Japan
I have been in marketing for over 9 years and have done a wide range of BtoB and BtoC marketing, including web advertising work, content marketing, community marketing, and account-based marketing. I have also been involved in launching and managing new businesses, and have been using Tableau since my first career, bringing data-driven ideas to a variety of markets. From my own business experience, I strongly feel the need for Tableau Prep in Japanese business, and have established the Tableau Prep User Group to promote awareness and utilization. In addition, in order to further grow marketing in Japan, I am working to promote Marketing-Ops that is suited to the Japanese way of working.

Muhammad Azhar

View Profile

Muhammad Azhar

Dubai, United Arab Emirates
Hello, my name is Muhammad Azhar. My journey from a small village in Pakistan to the corporate skyscrapers of Dubai has been thrilling, and each step has been guided by a single passion: telling stories with data. Tableau is my faithful companion on this trip as I work as a Business Analytics Specialist. I have been acknowledged as a Tableau Featured Author, and it isn't just a title to me – it's an affirmation of the hours spent mastering this craft. And those Vizzie Award nominations? They serve as reminders that passion, when coupled with dedication, does get noticed. My degree in Computer Engineering from COMSATS University Islamabad served as the foundation for my interest in technology. However, it was during my college years that I became acquainted with the field of data visualization. When I'm not knee-deep in data, you'll probably find me lost in a book. I've got this thing for psychology; understanding how minds tick is just fascinating. Maybe that's why I love data viz so much – it's about connecting the dots and understanding what makes people tick.

Naresh Suglani

View Profile

Naresh Suglani

Birmingham, United Kingdom
I am a Senior Tableau Developer, with a keen interest in visualisation and UI/UX techniques as well as GIS applications to develop innovative solutions for my business to make key business decisions.

Nicole Mark

View Profile

Nicole Mark

Tampa, United States of America
Nicole is a visual learner and communicator who found her passion in the field of data visualization. She started out making maps of imaginary worlds and cataloging her volumes of The Baby-Sitters Club on her family's original Apple Macintosh. Now, she analyzes and visualizes data in Tableau and with code, always on a Mac! She writes about dataviz, life with ADHD, and the modern workplace in her blog, SELECT * FROM data. Nicole co-leads Women in Dataviz and the Healthcare Tableau User Group. She’s working on her master’s in data science at the University of Colorado, Boulder.

Nilton Kazuyuki Ueda

View Profile

Nilton Kazuyuki Ueda

São Paulo, Brazil
Nilton Kazuyuki Ueda is an experienced professional in the field of data analysis, with extensive experience in various businesses, both in Brazil and abroad. His experience is marked by passage over the years in companies in the segment of public services, consumer goods, food retail, pharmaceuticals, aviation, loyalty programs, animal retail, among others. Over the years, due to his deep experience with the leading analytics platform, he was named the first Tableau Ambassador in Brazil and Latin America; title that is awarded to less than 50 people around the world He currently holds a position as Data Product Manager connecting business initiatives with technology to promote greater efficiency in operations. As a way of thanking him for everything he has achieved over the years and always keeping the "give back" thought in mind, he is also a professional speaker at events from small to large; having already spoken to more than 10,000 people in keynotes and is also an MBA professor at 5 high-level universities in São Paulo, having directly impacted the training of thousands of professionals in the data and technology area over the last 5 years.

Nisa Marques

View Profile

Nisa Marques

London, United Kingdom
Nisa is an expert in strategic leadership, particularly in promoting data literacy, analytical insights and analytics products on an international scale. She has been an active member of the Tableau community since 2016 and has co-led successful Data+Women initiatives, aiming for more gender diversity in tech. Managing both internal teams and external vendors, Nisa has successfully spearheaded digital transformation and analytics programs for a major global brand. Since 2019, she has served on the Viz for Social Good board, where she focuses on using data visualisation and storytelling to empower non-profit organisations and advocate for social equity and sustainable development.

Paul Chapman

View Profile

Paul Chapman

Newington, United Kingdom
I started in retail at Tesco, where I was always known as the “data guy”, providing insights into performance through coloured post-it notes on brown paper. Following that, I moved to easyJet as an accountant, where we had so much data, but we were using Excel as our business information tool. I wanted to create a Treemap visualisation I had seen on the BBC, which ultimately led to us evaluating BI tools and introducing Tableau. I then led the BI programme, developed their World Class centre of excellence, started leading the London Tableau User Group, and was named a Tableau Ambassador. In 2015 I switched to Jones Lang Services (JLL). I was excited by the data journey Corporate Real Estate was on, leading their largest global account team and driving innovation and tool adoption across the BI space whilst delivering over $40m of quantified benefit through BI. In 2020 I was named the global lead for BI, performance management and Innovation, taking the work I had previously done and creating an international community of 150 data practitioners based across nine Countries to maximise our benefits.

Prasann Prem

View Profile

Prasann Prem

New Delhi, India
Prasann Prem is the Founder of VizDiner and is a Data Visualization Coach who aims to enable companies and young professionals with data visualization and storytelling skills. He is also the founder of the Tableau Buddy program through which he has mentored over 1000+ data aspirants across the globe, and has been recognized as a Tableau Visionary and a Tableau Ambassador.

Rika Fujiwara

View Profile

Rika Fujiwara

Tokyo, Japan
Rika Fujiwara is a BI Consultant at Slalom Japan and a recognized 2022 Tableau Public Ambassador. Her work has earned spots in VOTD and Tableau Conference Viz Galleries. Now serving as a Social Ambassador, she promotes 'cross-border activity' to benefit the #DataFam community. She spearheads collaborations beyond Tableau, including integrations like Snowflake x Tableau and Data Science x Tableau. Fluent in Japanese and English, she is passionate about linking the global #DataFam and bridging Japanese and English-speaking communities. For borderless collaboration opportunities, reach out to her on Twitter or LinkedIn.

Sam Batchelor

View Profile

Sam Batchelor

Brisbane, Australia
Sam has been working with Tableau for many years as a developer and server admin. She has taught Tableau Desktop across Australia and is currently a Data Visualisation Lead for a large Australian retailer. Sam loves to share her knowledge to try and make it easy and fun for others to learn Tableau. She co-presented the "Tableau Speed Tips" session at the Tableau Conference in 2023 in Las Vegas, and used to co-host the virtual, global "Analytics Tableau User Group". She loves the musical "Hamilton" which she was awarded Viz of the Day in 2021. Sam loves music, and sings in bands in her hometown of Brisbane, Australia.

Sean Miller

View Profile

Sean Miller

Kansas City, United States of America
Sean is the Associate Director of Data Visualization at Concord Consulting and has been using Tableau since 2015. At Concord, he leads the data visualization practice (Evolytics) and works with clients from all over the world to make a positive difference with data. Sean's enthusiasm extends outside of Concord as he leads and participates in various global Tableau community initiatives. He hosts a weekly livestream on YouTube, is a #WorkoutWednesday coach, leads the #DataPlusMusic project, and co-leads the Kansas City User Group. He has been recognized for his contributions and has earned the title of Tableau Visionary and Ambassador. His work is featured in the book, "#MakeoverMonday: Improving How We Visualize and Analyze Data, One Chart at a Time"

Sekou Tyler

View Profile

Sekou Tyler

Nashville, United States of America
Sekou Tyler is a self-proclaimed "data geek" a computer aficionado who combines the scientific elements of data analysis with the narrative properties of data visualization. His degrees and certifications have allowed him to use his version of data storytelling in several industries. Sekou is fascinated by the learning process; he actively seeks out ways to improve his skillset and uses different tools to display actionable data to empower people to make better data-driven decisions. Sekou has also artfully fashioned professional development workshops. Aside from all things data, Sekou enjoys speaking, mentoring, and sports, but most of all he's happiest spending time with his wife and daughter.

Simon Beaumont

View Profile

Simon Beaumont

Liss, United Kingdom
Simon is BI Director at JLL and he supports a team of analysts to translate complex data into meaningful business insights for operational and senior leaders. He is passionate in his belief that BI Teams must be more than just technical excellence, they should be underpinned by a culture of continuous learning, innovation, and collaboration; beliefs that were all founded on his regular interactions with the Tableau Community. In his spare time Simon's passion is sports; in 2018 he combined his love of data and sports to help co-found Sports Viz Sunday.

Steve Adams

View Profile

Steve Adams

Birmingham, United Kingdom
Steve Adams is a Tableau trainer, coach, developer and the founder of VizDJ.com. With 20 years of director-level experience, he has zoned in on data visualization to enable better decision-making for organisations. Tableau is his weapon of Dashboard construction. He curates the weekly Tableau Bites newsletter, manages the LinkedIn Tableau Training page, co-leads the Birmingham Tableau User Group, and is a sought-after industry speaker. His passion? Empowering people with Tableau skills to drive performance and change lives.

Takehiro Takano

View Profile

Takehiro Takano

Tokyo, Japan
Takehiro works as a BI engineer at a Japanese IT company, and as a partner of Taberau, he mainly supports Tableau implementation, visualizing data using Tableau Desktop and managing Taberau Server. He is a member of Japan Tableau User Group (JTUG) and organizes ”#Tableauルノアールユーザー会” and "#Tableau兄さんチャレンジ", where he asks Tableau questions. He also sends out small stories related to Tableau on X(@tableau_nisan) and holds moku-moku-kai(Social gathering among Tableau users) in Tokyo.

Thi Ho

View Profile

Thi Ho

Singapore
Thi Ho is a data & digital product owner based in Singapore. She was a Tableau Public Featured Author in 2020 and is a four-times Tableau Ambassador (2020 to 2023) and APAC leader of Viz for Social Good community. Thi is passionate about communicating data effectively and help her stakeholders to make data-driven decisions, as well as creating data & digital products that make positive impacts! She has been leading initiatives in the #DataFam community and at work to advocate for data literacy, data democratization and build data capabilities. She is also passionate about building communities, be it #DataFam, #VizforSocialGood, or the community in her company, as she believes that with the power of community, learning can be accelerated for the good of individuals and organization as a whole. Thi also enjoys coaching and mentoring. Thi loves a good coffee and travelling and she can't wait to meet more #DataFam friends in person!

Vani Agarwal

View Profile

Vani Agarwal

Gurgaon, India
Vani loves to investigate data and develop stories using it in her profession as a Data Visualization Engineer at Expedia Group. She has been a contributing member of the tableau community for some time and is currently co-leading the Tableau Buddy Talks user group. She also likes to write about new things she learns at work and post them on her blog site. In addition to her job, she enjoys mentoring students and teaching tableau and data storytelling.

Vince Baumel

View Profile

Vince Baumel

Rosemount, MN, United States of America
Vince is a husband and father of 3 in Minnesota, and a senior manager of BI &Analytics with JLL. He is passionate about public speaking, building community, and encouraging those around him. When he’s not chasing kids or data insights, you’ll find him building something in his workshop or in front of a piano! This is his 5th year as an ambassador, and each year has brought new ideas and new excitement for how to drive the community forward.

Will Perkins

View Profile

Will Perkins

Lewisville, United States of America
Will found his passion for Data Viz less than a decade ago after a winding career with many types of roles. As an Executive Director at JPMorgan Chase, Will is a champion of evolving the business users to see "the are of the possible" and encourages developers to challenge the status quo. Over his tenure at the firm, he has been highly active in cultivating a successful culture of data and curiosity. Publically, Will is very active on X (Twitter) to help encourage and promote the Tableau Community. So many people start their journeys at different points so he wants to help create a safe and comfortable space for them to feel welcomed and heard. He also loves posting random gifs and talk about soccer.

Yasushi Ishikawa

View Profile

Yasushi Ishikawa

Kawasaki City, Kanagawa, Japan
Very much excited to coming back to Tableau Ambassador!! I have been working in Finance & Accounting area for long time, and in analysis role using Tableau since 2015. There Tableau changed my life - it helped me make many break-thorough in day-to-day work, and I have received a couple of viz contest awards - company internal, sponsored by governmental org. etc. I am trying to share my experience and thoughts - how much we can benefit from Tableau, even not perfectly skilled. And even simple, casual use of Tableau is good enough to change the game!

User Group Leader Ambassadors

User Group Leader Ambassadors are dedicated to helping communities and community members thrive by leading their local or virtual user group. They share best practices and provide mentorship to new leaders.

Alex Waleczek

View Profile

Alex Waleczek

Auckland, New Zealand
Alex started using Tableau in 2015 after moving to New Zealand and quickly realised the potential for it to be more than just a reporting tool. He got involved with the local Tableau User Group, first as a presenter and organiser, later-on as a host. As an active member of the community on Twitter, he helped organising the Tableau Fringe Fests and the #DataFamCommunityJams. After working for a Tableau partner and a customer, he now leads the Analytics Practice for the largest Salesforce partner in New Zealand. He still leads the Auckland Tableau User Group and the APAC #Datafam Check-In, co-organised VizIt Sydney and joins community events wherever he can.

Alina Cristea

View Profile

Alina Cristea

London, United Kingdom
Alina works as Analytics Lead at Randstad, the world's largest recruitment agency, where she is responsible for promoting analytics best practices and fostering the Tableau creator community. Alina has previously worked for Tableau in their professional services team as an analytics consultant. During that time, Alina found her passion for visual analytics, training others to use Tableau Desktop and topics such as best practices for data analysis & visualisation. Alina was introduced to Tableau in 2016 whilst working as a junior analyst and quickly fell in love with the tool. Over the years, she's been a frequent attendee at community events such as Tableau Days, Tiny Tableau Talks and the London Tableau User Group, which she was selected to co-lead in 2023. Outside of work, Alina spends a lot of time outdoors, especially playing tennis, occasionally hiking and running.

Aloysius Ong

View Profile

Aloysius Ong

Singapore, Singapore
Aloysius started using Tableau in 2020 while pursuing his university education and fell in love with data visualization. After embarking on #dailycoding, he was nominated as a Tableau Public Featured Author in 2020 and served as a Tableau Social Media Ambassador for a year from 2021. Aloysius is passionate about sharing and creates content from time to time, showcasing his passion projects and study notes from online courses. He is currently co-leading the Singapore Tableau User Group. In his free time, Aloysius enjoys immersing in novel experiences, be it a book, a movie, a game, or an art exhibition.

Anna Foard

View Profile

Anna Foard

Stan's, United States of America
Former math and statistics teacher turned data storyteller and data literacy advocate. Top 1% parallel parker, 12th percentile dishwasher loader, mediocre ultramarathon runner. Solution architect at Analytic Vizion.

Brandi Beals

View Profile

Brandi Beals

Milwaukee, United States of America
Brandi has been using Tableau for over 12 years in a variety of enterprise capacities and is certified both in Tableau Desktop and Tableau Server. She is focused on delivering an enterprise analytics platform and enabling data capabilities across the organization. Skilled in Tableau, Alteryx, and Python, she has a strong technical track record supported by a Masters of Science in Predictive Analytics from Northwestern University. In addition to co-leading the Milwaukee Tableau User Group and Wisconsin Tableau User Group, Brandi runs the Data Book Club and co-hosts the Data Careers Summit.

Candice Munroe

View Profile

Candice Munroe

Halifax, Canada
Candi is passionate about data and loves being a member of the #datafam. She is Founder and Principal Consultant at Paint with Data. She believes in helping others up their data game and making decisions based on fact - painted on a pretty canvas of course! She has helped companies, including Kraft Heinz and Cadillac Fairview, pick up their visual analytics game - driving to better business decisions across multiple lines of business. Candi is a leader of the Canada Tableau User Group and is a two-time Tableau User Group Ambassador for 2021 and 2022.

Chris Williams

View Profile

Chris Williams

Aliso Viejo, United States of America
Mr. Williams founded Precision Analytics Group to improve the productivity of our clients through a combination of optimizing data analytics systems, data blending, and comprehensive reporting. Building on the deep business and government intelligence knowledge of our staff, we deliver excellent analytical value for our clients. By delivering comprehensive solutions, we develop successful business relationships through mutual trust and respect. Mr. Williams has over 27 years of experience in designing, leading, and implementing full life cycle Business Analytics and Predictive Analytics.

Christopher Scott

View Profile

Christopher Scott

Raleigh, United States of America
Christopher Scott is a results-driven Data Enablement Manager with over 12 years of experience in optimizing data sources, creating interactive dashboards, and providing training and support. Proven expertise in Tableau, data visualization, and analytics platforms. Adept at collaborating with cross-functional teams to consolidate reporting and implement visualization best practices. Skilled in managing Tableau Server and driving the development and production process. Strong leadership abilities as demonstrated by leading teams including the Raleigh-Durham Tableau User Group.

Diego Parker

View Profile

Diego Parker

London, United Kingdom
Diego is a BI Strategy Manager at Lloyds Banking Group, where he leads the adoption of Tableau across the group. Originally from Chile, he moved to the UK in 2018 and joined The Data School, part of The Information Lab. There he learned Tableau under some of the best users in the world and set on a mission to solve complex problems using data. He is a Tableau Visionary and co-leader of both the LATAM [ComuniDatos] and London Financial Services user groups. He also loves making Latin American food and drinks!

Ella Worsdale

View Profile

Ella Worsdale

Glossop, United Kingdom
I am currently the Head of Business Intelligence for Integral UK (JLL) and co-lead of the UK Northwest Tableau User group. I discovered Tableau in 2014 and went on to successfully implement Tableau across a large NHS Trust which enabled a huge shift in the use of data for the organisation. I have recently repeated this success in my current organisation. I am proud to have been a Tableau Ambassador since 2019. I recognise the benefit of having a great network to enable shared learning and encouraging others to succeed. It is great to be part of such an active and supportive community, and I love being able to bring people together through the user groups. The Tableau community has had a huge impact on my life and my career, and I am humbled to be recognised again as an Ambassador.

Ellie Slater

View Profile

Ellie Slater

London, United Kingdom
Ellie Slater currently works as an Enablement Manager at John Lewis Partnership, but started her Tableau journey as part of the Information Labs’ Data School in 2018. She is a big evangelist for the data community and has a real passion for promoting and celebrating the achievements and success of using data to drive analysis & decision making. Ellie has co-lead Data Plus Women London since the beginning of 2020 and whilst there were some great virtual events, she brought it back to life with in person events from Spring 2023. Her favourite way to interact with data is to collect & analyse quantified-self data - whether that’s Strava, Netflix or even health data. Outside of the #datafam, Ellie can be found running, playing tag rugby, travelling the world or immersed in a good book.

Eric A Howard

View Profile

Eric A Howard

Nashville, United States of America
As a dedicated data leader, Eric's journey with Tableau Users Groups began at his first Nashville TUG meeting. Instantly connecting with like-minded individuals who share his passion for all things data. Whether the conversation revolves around financial, healthcare, or research data, Eric revels in these discussions because, for him, all data is valuable and fascinating. Eric's enthusiasm for helping others in the data community is what draws him back to these gatherings time and again. In the unique world of TUGs, he often finds that he gains as much as he gives, making these interactions wonderfully enriching. As the Manager of Data Analytics for a prominent surgical practice within a major regional university medical center, Eric is immersed in a sea of data daily, predominantly in revenue cycle and finance. When the Nashville TUG faced challenges in 2019, Eric recognized the importance of revitalizing it. Teaming up with a dedicated leadership group that emerged during TC19, he ensured the TUG's survival during the pandemic and helped it thrive in a newly virtual landscape. This year, Eric is helping launch a new Tableau Public Users Group in 2023. When Eric isn't immersed in the world of data, you can find him paddling along one of the local rivers or scaling the sandstone crags that Tennessee has to offer.

Ethan Lang

View Profile

Ethan Lang

Lansing, United States of America
Ethan Lang is the Director of Analytics Engineering at Playfair Data, where he leads an award-winning visual analytics engineering team. His unique problem-solving style has created innovations for organizations from non-profits to Global 10 enterprises. He holds a Bachelor in Business Analytics from the University of Kansas and a Master in Applied Statistics and Analytics from KU Medical Center. He is also currently authoring his first book "Statistical Tableau" with O'Reilly publications.

Fraser Gallop

View Profile

Fraser Gallop

Edmonton, Canada
Fraser Gallop is the CEO of Onware with two decades of successful experience in working to activate data. He specializes in data architecture and regularly works with tools such as Tableau and Power BI. Fraser is a highly experienced Software Executive who has demonstrated the ability to lead diverse teams of professionals. Strong technical and business skills with an impressive track record of hands-on experience including business intelligence and analytics consulting, web and mobile software development, project management, and business development. He enjoys golf, travel, and has recently been playing with vintage electronics and gadgets in his spare time.

Frederic Fery

View Profile

Frederic Fery

Brisbane, Australia
My name is Frederic, I live in tropical Brisbane Australia. I am originally from France. For work for big Australian retailer as data visualisation manager. Originally from a marketing and comms background, I discovered Tableau in 2016 and have been in love with data visualisation and Tableau ever since. So much that in my spare time I enjoy creating data visualisations about politics, sport, (Australian) social issues & social good and post them on my Tableau Public profile. In the Tableau community, as a Tableau Ambassador, I love getting involved with data community activities to learn and make new friends. I lead the Brisbane Tableau User Group meetup, and as a Viz For Social Good Director, I help charities promote the use of data visualisation for social change. I also love teaching Tableau, mentor students and young data practitioners.

Ginny Moench

View Profile

Ginny Moench

Wilkesboro, United States of America
By day, Ginny is an Enrollment Management BI Analyst at Appalachian State University, where she has worked since 2019. In her off time, you might find her feeding chickens, gardening, kayaking, shopping for vintage books, or cooking up something delicious! Ginny has a background in Anthropology with degrees from Wake Forest and New Mexico State. In 2012, she was starting her dream career in higher education when she discovered Tableau and fell head over heels in love. At first, she learned to use Tableau through trial and error until she finally discovered the Tableau Community. Those early days inspired her to start Analytics Day in 2018 and co-found the Higher Education Tableau User Group in 2021.

Heidi Kalbe

View Profile

Heidi Kalbe

Lübeck, Germany
Heidi has made it her mission to promote and improve diversity in the data community, especially through her work as founder and co-leader of Data + Women Germany, as well as her co-leadership of Rheinland TUG. Ever since discovering Tableau, she has been liberally sharing her enthusiasm and expertise with users all over the world through countless user groups, conferences, guest lectures, her blog, and even the occasional song. Turning passion into profession, Heidi's current role as Senior Consultant at Woodmark Consulting AG allows her to do what she does best: inspire others with her passion for a company-wide analytics culture. The only thing Heidi loves more than Tableau are alpacas.

Hiroaki Morita

View Profile

Hiroaki Morita

Yokohama, Japan
I believe in "making the world a better place with data." I have been working with data and analitics for more than 30 years and using Tableau for more than 10 years. It has been a lot of hard work. But I don't intend for others to have to go through the same hardships. I want to share and contribute my learnings and experiences with as many people as possible. I was selected as "PREPSTAR" at Tableau Conference 2023 Vizzies Aword. I’d like to say thanks to the people who nominated me. With this opportunity, I'm starting activities to spread the excellence of Tableau PREP in Japan.

Jack Parry

View Profile

Jack Parry

New York, United States of America
As the Head of Commercial Development at The Data School New York, I lead a team of talented Tableau and Alteryx consultants who deliver data-driven solutions to clients across various industries. With more than 6 years of experience in data analysis and visualization, I have a strong track record of creating impactful dashboards, automating workflows, and generating insights that drive business decisions and outcomes. I also leverage my background in neuroscience to apply cognitive and behavioral principles to data storytelling and user experience design. Previously, I was the Solution Consulting Lead at The Data School New York, where I managed the pre-sales and post-sales processes, and built strong relationships with clients and partners. I am passionate about empowering people and organizations to become more data literate, agile, and innovative. I am always eager to learn new skills, collaborate with diverse teams, and tackle complex challenges. My goal is to help The Data School New York grow its presence and reputation as a leading data education and consulting provider in the US market.

Jen Shepherd

View Profile

Jen Shepherd

Brooklyn, United States of America
Jen Shepherd has been into data viz since 2014, applying visualization best practices as well as creativity in the non-profit, for-profit, and government sectors. She has a PhD in Social Psychology and enjoys helping organizations collect, analyze, understand, and especially use their data. She’s currently a contractor who builds data viz and interactive data dashboards for internal and external audiences. She also analyzes data and trains others in data literacy and on how to use Tableau. Jen has been on the leadership team for the Madison TUG for six years, where she presents regularly and is very enthusiastic about motivating the TUG to volunteer and #dogoodwithdata.

John Whitmer

View Profile

John Whitmer

Boston, United States of America
John is a nine-time Vizzie Award Nominee and a Co-Lead of the Boston Tableau User Group. Outside of the occasional baseball viz, it might seem like there is no consistent theme to John’s visual or analytical style but that is 100% intentional. He views each viz as an opportunity to try out new chart types or new design elements as a way to continue growing and keep his aesthetic from feeling stale. Professionally, John is the Manager of Competitive Intelligence Analytics at Staples, where his team uses Tableau to generate actionable insights and make data-informed pricing decisions through their interactive dashboard solutions.

Julia Büchting

View Profile

Julia Büchting

Mainz, Germany
From Artist to Data Artist: When Julia discovered Tableau in 2019 she changed her career completely from sculpting statues to creating line charts. She is a Senior Consultant with Deloitte. Her philosophy for dashboards is "form follows function" and she uses visual attributes, UX-habits and iconography to make great data communication possible. She loves organizing TUG Munich events and has recently launched the Data+Women Germany lunch-series with Heidi Kalbe. If she is afk, you can find her in her art studio. printing with the intaglio press, cutting linos or developing cyanotypes.

Laura Sandford

View Profile

Laura Sandford

Cambridge, United Kingdom
Laura is a self-proclaimed data nerd who loves nothing more than to learn. She found a love for data during her PhD in Chemistry and at the same time realised that a life in academia wasn't for her. She began a career in analytics just to pay the bills but hasn't looked back. Through a combination of self-teaching and community support Laura has become an avid Tableau user and co-leads the London Tableau User Group. She is part of the #jlldatafam, working as a Senior Director at JLL, challenging and informing decisions with data and insights. Outside of all that Laura adores her two Labradors (Henry and Barney), plays netball (poorly), bakes (pretty well) and is an avid Rochdale AFC fan.

Margarita Moya

View Profile

Margarita Moya

Sydney, Australia
Margarita is an Enablement Director (APAC) at JLL, a global real estate services firm specialising in commercial property and investment management. She also co-leads the Sydney Tableau User Group with some amazing folks and is based in Sydney, Australia Outside of work, she is registered on Tableau Service Corps and is a Board Member of Engineers Without Borders Australia - a for-purpose organisation harnessing the potential of engineering to create an equitable reality for the planet and its people.

Maryse Monen

View Profile

Maryse Monen

Amsterdam, Netherlands
Hello, I'm Maryse, and I'm thrilled to be chosen as a Tableau Ambassador for the third time! I'm passionate about helping people make sense of data, and my Tableau journey began during my time at the University of Applied Science of Amsterdam. Ever since, I've been dedicated to making data accessible and understandable. As a consultant, I offer Tableau trainings and create visually appealing yet concise dashboards for various companies. Outside of work, I'm known for organising events like #DataPlusWomen and the Dutch #TUG sessions, fostering a collaborative atmosphere in the Tableau community. You can also find me sharing my love for data on my Instagram profile. I thrive in an environment that values learning, growth, and creativity, which I've found in the collaborative atmosphere fostered by The Information Lab and the #DataFam community. In addition to my data-related pursuits, I find solace and balance in the great outdoors and the mountains. My partner resides near the Swiss Alps, and skiing is both a passion and a source of rejuvenation for me. I'm also a skilled cook who enjoys experimenting in the kitchen, crafting delightful dishes that mirror my belief in structured processes. Moreover, I'm an avid camper, which allows me to disconnect from the digital world and embrace the beauty of nature. Through these diverse interests, I've learned the value of balance and perspective, which I believe enriches my contributions to the Tableau community. As a Tableau Ambassador, I look forward to connecting with fellow enthusiasts, sharing knowledge, and exploring how our shared passions, from data to the great outdoors, can drive innovation and insight."

Matt Lee

View Profile

Matt Lee

Bay Area, United States of America
Matt Lee is a Senior Data Analyst at Apple and is known as a Tableau and Data Visualization expert. He has over a decade of experience using Tableau since version 6.0, is currently leading the Bay Area Tableau User Group, and enjoys coaching/mentoring both new and long-time users of Tableau. Matt is an avid sports fan, a lifelong learner, and loves trying new boba tea shops.

Maxime Baux

View Profile

Maxime Baux

Strasbourg, France
Maxime Baux is a Freelance Data visualization & Analytics Consultant with a strong experience working with Data. He helps his customers to use and adopt data analytics tools by providing trainings, coaching sessions as well as by delivering bespoke solutions. Passionate about knowledge sharing and speaking, Maxime helped creating "Le French TUG", a French speaking Tableau user Group where experts share their knowledge and tips. Apart from working on advanced Tableau calculations and problem solving, Maxime also loves to meet new people,travel the world and discover new sports. Feel free to reach out to him on social media such as Linkedin, He is always happy to discuss Data, Tableau or about the Freelance life.

Mika Fukuda

View Profile

Mika Fukuda

Tokyo, Japan
Mika works in Japan as a BI Engineer. Meeting inspiring, amazing, and respectful people through the Tableau community has changed my life and values. I am a member and leader of 8 user communities. I enjoy running community events and making them fun and meaningful for those who attend. Thank you for a wonderful experience!

Ron Eisenstein

View Profile

Ron Eisenstein

Evanston, United States of America
Ron first discovered Tableau in 2009. He was delighted and amazed. Currently the Engineering Team Lead for EverTrue and co-leader of the Advancement TUG, he is passionate about making Tableau data visualizations accessible and actionable. Ron earned a BA in political science from Washington University in Saint Louis, and an MS in information systems from DePaul University. Outside of work, he enjoys theater and the outdoors, where he loves exploring new places with his husband and greyhound rescue, Nifty.

Roshni Gohil

View Profile

Roshni Gohil

United States of America
Roshni Gohil is an analyst at MIT's Investment Management Company (MITIMCo). While not knee-deep in data and Tableau, or trying to learn how real estate and investment management work, she tries to push user-centered design, business analysis, and project management processes and methods on (sometimes) unsuspecting colleagues. Prior to MITIMCo, she spent 14 years across MIT, analyzing fundraising data in Resource Development, supporting end-users of the MIT Data Warehouse, and managing student employees and overseeing course reserves at the MIT Libraries. She co-founded and co-leads the Higher Education TUG (HETUG) and MIT's internal TUG, and co-leads the Massachusetts Higher Ed TUG (MUG).
 

Ruy Aguilar

View Profile

Ruy Aguilar

Atlanta, United States of America
Ruy Aguilar, an accomplished bilingual business operations and analytics leader, possesses an unwavering drive for operational excellence and leveraging data-driven insights to achieve remarkable success. Having extensive experience in business management, pricing, finance, sales operations, and analytics, Ruy is a respected industry professional. His journey began in operations and finance roles at Marriott and Frenoseguro, where curiosity led him to explore diverse departments, understanding the profound impact of business decisions on profit and loss statements. Excelling in a pricing role at Sony Mobile, he collaborated closely with sales teams and clients to delve into the sales process and customer interactions. Transitioning to Sales Operations and Enablement roles at IHG marked a pivotal turning point in Ruy's career. In these roles, he swiftly became a trusted advisor to Sales and Commercial leaders, providing invaluable insights and guidance. At IHG, Ruy merged his passion for support with his professional acumen, co-founding the Latinx Employee Resource Group and fostering a supportive community for Latinx professionals. Continuing at LPL Financial, Ruy served as an AVP of Business Intelligence and Project Management. In a short span, he earned respect, emerging as a go-to leader for Analytics Enablement. His fervor for fostering communities and driving data-driven initiatives led to a vibrant Tableau community within LPL. Acknowledged with an invitation to the Analytics Center of Engagement leadership team, he solidified his influential role in shaping the organization's analytics strategy.Ruy's dedication extended to founding Comunidatos, a thriving community for Latinx Tableau users, and co-leading the Financial Services Tableau User Group, contributing to the growth of data and analytics communities. His exceptional contributions to the Tableau community earned him the distinction of a two-time Tableau Ambassador and a respected leader within the community. His latest endeavor involves founding the Career PathMakers community, collaborating with Tableau Visionaries, Ambassadors, and community leaders to establish mentorship and transition support programs for aspiring data professionals. Ruy's commitment to mentoring and motivating others in their data and analytics careers has profoundly impacted countless individuals. In addition, he is in the process of writing the book: Tableau Interview Guide: The Ultimate Tableau Developer Job Search Handbook from Vizzes to Offers. Currently serving as a Tableau Evangelist at Keyrus, Ruy shares his extensive knowledge with fellow data and analytics consultants. Collaborating across diverse industries, he assists clients in solving intricate business problems through innovative analytics solutions. Ruy Aguilar's unwavering dedication to operational excellence, community building, and mentoring aspiring data professionals has solidified his reputation as a highly regarded leader in the field of business operations and analytics. With his profound expertise and unceasing pursuit of excellence, Ruy continues to create a meaningful impact, transforming organizations and empowering individuals on their data and analytics journeys.

Sarah Carr

View Profile

Sarah Carr

Madison, United States of America
Sarah Carr (she/her) has been using Tableau since 2019, and participating in the #datafam community has been a big part of her learning. She has a PhD in industrial/organizational psychology, where she developed skills in survey design, data analysis, and program assessment. She is currently a research analyst for the State of Wisconsin and enjoys building data visualizations that help people understand and use data in a meaningful way. Sarah joined the leadership team of the LGBTQ+ Tableau User Group in 2022. She is dedicated to making the Tableau community a constructive and safe space for people to learn about data visualization, improve their skills, and be their authentic selves.

Serena Roberts

View Profile

Serena Roberts

Lakeville, MN, United States of America
Serena Roberts is co-founder and self-proclaimed Chief Get-shit-done Officer at Moxy Analytics. She specializes in data visualization, data literacy and community-building in service of enabling data culture. Serena holds almost two decades of experience working in data and analytics in a variety of industries, and technical and non-technical roles. Since 2016, she’s led the Twin Cities Tableau User Group as well as She Talks Data; a Minneapolis-based group focused on improving gender equality in data-related fields. She’s been recognized 6x as a Tableau Ambassador for her commitment to building and contributing to the #datafam.

Timea Toltszeki

View Profile

Timea Toltszeki

Amsterdam, Netherlands
Timea Toltszeki is a highly experienced professional in the field of business intelligence. Currently serving as Head of Data and Platforms for Boehringer Ingelheim. Timea holds a degree in economics and political science, during her studies that she found love for statistics and data. Timea is deeply passionate about making a positive impact on communities. She is driven by a strong desire to enable and empower communities through her work. In 2022, she launched her own website called Data Unicorn, where she shares valuable insights and resources related to data. Timea takes great pride in her role as a leader of Data + Women TUG in Amsterdam, where she actively promotes diversity and inclusion in the data field. Outside of her professional endeavors, she enjoys practicing Brazilian Jiu-Jitsu or dancing bachata. She also cherishes the time spent with her family and beloved dog, Lily.

Tomoko Wakamatsu

View Profile

Tomoko Wakamatsu

Japan
I am currently working as a Sales Engineer at Snowflake.I am honored to be named Ambassador for the third year in a row!I became involved in the Tableau community in 2018, where I met many great people and now lead the community. The user community I am a part of is diverse. Supporting various events and discovering new Data Heroines and Heroines of User Groups is now my hobby and pleasure.

Tore Levinsen

View Profile

Tore Levinsen

BERGEN, Norway
Tore is a Tableau Jedi at Inmeta Consulting with experience in Tableau since version 7.0 (when filled maps and area charts were introduced). He is based in Bergen, Norway, and is one of Europe's most merited Tableau Trainers, with over 3.300 people trained in 15 countries. He is also the leader of TUG Norway since 2018 and have been co-hosting Vizit London 22 and Vizit Berlin 23. He has over 20 years of experience as a consultant, advisor, trainer, and lecturer at universities. He has over 60 Tableau t-shirts/hoodies and a growing swag compilation! On his spare time, he supports Liverpool FC and are a handball and football coach for youths.

Viraj Bhargave

View Profile

Viraj Bhargave

Mumbai, India
Viraj has always been a data player and is passionate about community engagement, Data visualization, and Tableau, since 2019. He loves problem-solving and helping others. His enthusiasm towards community involvement and willingness to help others has led him to become the subject matter expert (SME) in Tableau within his current organization, Merkle. As a Lead Data Analyst, he actively manages an internal Data Visualization community, overseeing training sessions, mentor connects, and learning series as integral parts of this internal initiative. Since 2022, Viraj has joined the elite Tableau Newbies User Group as a co-leader. He can be reached via his social media name, DataTasteMaker.

Yamil Medina

View Profile

Yamil Medina

Orlando, United States of America
Yamil work as Senior Data Engineer Consultant and is a certified Tableau trainer. He has experience with a diverse range of data from CPG, entertainment, travel, e-commerce, and financial services. In the past, he has worked for leading companies including Dean Witter, Morgan Stanley, Banco Popular, Sun Trust Banks, and Comcast NBC/Universal Parks and Resort. He is also a 10+ years co-leader of the Orlando / Florida Tableau User Group and also in recent years co-leader of Comunidatos, the Latino/Hispanics TUG. Living in Orlando the theme park capital of the world, he is passionate about data related to travel. When he is not reading everything, he can about data visualizing and Tableau, you can find him traveling through the beautiful state of Florida in search of new local eateries, Cycling, BBQ enthusiast, relaxing at a nearby beach, or racing off-road vehicles.

Yoshie Mitamura

View Profile

Yoshie Mitamura

Tokyo, Japan
I am engaged in talent development within our company in the fields of data and digital technologies. I am a member of the Tableau Prep User Group in Japan. Every weekend, I participate in gatherings with Japanese Datafam, where we enjoy sharing and providing advice on the visualizations we have created. Additionally, I take part in self-learning sessions for Tableau Prep. I am thrilled to have the opportunity to gain new insights from these sessions.

Tableau Public Ambassadors

Tableau Public Ambassadors showcase the power of Tableau with the incredible visualizations they share with the community. They welcome newcomers to the Tableau Public platform by creating a healthy space for feedback, appreciation, and connection.


<

Abdelaziz Mahjoub

View Profile

Abdelaziz Mahjoub

Egypt
Abdelaziz is a Data Analytics Lead Consultant at a Tableau Gold Partner firm in the MENA region. He has more than a five-year track record of professional experience in data analytics, along with exceptional data visualization skills backed with practical and academic knowledge of essential design principles and techniques. ِAdditionally he's been a Tableau instructor and Cairo TUG Leader for the past 3 years. He's a 2x Tableau Public Ambassador, a Tableau Public featured author and 1x #VOTD. Abdelaziz's mission is to empower and support the Data Visualization enthusiasts and Tableau community in Egypt.

Adedamola (Damola) Ladipo

View Profile

Adedamola (Damola) Ladipo

Washington, DC, United States of America
Damola, Senior Data Visualization Specialist at DevTech Systems, develops dashboards and standalone visualizations for USAID Data Services. He joined Tableau Public in 2020, earned featured author recognition in 2021, and became a Tableau Public Ambassador in 2022. Tableau Public inspires him and connects him with the #DataFam community. Beyond Tableau, Damola plays soccer, watches the Premier League, enjoys documentaries and psychological thrillers, and reads graphic novels. One of his favorite adventures was exploring Wadi Rum, Jordan.

Agata Ketterick

View Profile

Agata Ketterick

Scarborough, United States of America
Agata first discovered Tableau in 2016 and hasn't looked back! She completed every #MakeoverMonday challenge in 2020 and has been active in the Tableau Community since. Agata's Wordle viz placed in the Top 15 in the 2023 Iron Viz and she's earned a number of Viz of the Days. Agata co-leads the new Tableau Public User Group and the Northern New England User Group. As a data visualization consultant at Lovelytics, Agata loves helping clients find insight in their data in a visually appealing way. When she's not vizzing, Agata can be found adventuring with her family near her home in southern Maine.

Ali Tehrani

View Profile

Ali Tehrani

Arlington, VA, United States of America
Ali is a Senior Data Visualization Consultant at Lovelytics where he gets to help clients find insight in their data in a visually appealing way. He is now a 2x Tableau Public Ambassador, 3x recipient of Tableau Public’s Viz of the Day award, and a Tableau Public Featured Author. Outside of work, Ali enjoys creating visualizations about topics he is passionate about, such as psychology, sports, film and music. When not working on his next data visualization, Ali enjoys swimming, playing the piano, hiking, cooking, and watching sports, movies and shows.

Andy Kriebel

View Profile

Andy Kriebel

Ashington, United Kingdom
Andy Kriebel is a member of the Tableau Visionary Hall of Fame, and a prominent community leader, author, and blogger. He started the Tableau community programs Workout Wednesday and Makeover Monday. He co-authored the book "Makeover Monday" with Eva Murray. He also maintains a popular blog at vizwiz.com, where he shares tips, tricks, and insights on data visualization and Tableau. Throughout his career, Andy has helped thousands of individuals transform their careers in data analytics and is one of DataIQs Top 100 Influential People in Data.

Ant Pulley

View Profile

Ant Pulley

Letchworth Garden City, United Kingdom
I'm Ant, a senior data visualization developer at Lloyds Banking Group plc in the UK. I spend my working days in Tableau designing business dashboards and insights and spreading the Tableau love across the organisation. Outside of work, I enjoy using Tableau Public to explore what more you can do in Tableau, both the weird and the wonderful, ranging from animated Light Sabers to analyses of my Twitter account. I live with my wife and two daughters, and my main hobbies include playing the saxophone in multiple bands, and practicing Tae Kwon Do.

Bo McCready

View Profile

Bo McCready

Austin, Texas, United States of America
Bo McCready has been using Tableau since 2012 and has been a Tableau Public Ambassador since 2021. He loves creating visualizations about sports, pop culture, and history. He also is a screen printer who uses Tableau created and inspired designs to make t-shirts and prints in his garage. Bo earned his Ph.D. from the University of Wisconsin in 2014 and led analytics and research teams in urban education before transitioning to the tech world. He currently manages a data science team for Apple in Austin, Texas.

Brian Moore

View Profile

Brian Moore

Haverhill, MA, United States of America
Brian is a Data Visualization & Analytics Practice Team Lead at Cleartelligence, Inc. in Boston, Massachusetts. He is a self-proclaimed Tableau fanatic, and when he is not helping his clients get the most out of their data with Tableau, he is having fun on Tableau Public building unique visualizations. He is also active in the Tableau Community, co-leading the Boston TUG, blogging on his website, domoorewithdata.com, and teaching/mentoring newcomers to Tableau.

Brittany Rosenau

View Profile

Brittany Rosenau

Tavares, United States of America
Brittany is a design enthusiast who believes everyone is better with equitable access to data. She was introduced to Tableau Public through an internal enablement program in 2019 and has been hooked ever since. Brittany is a serial dabbler in community projects, 4 time Viz of the Day recipient, and was a finalist in the 2023 Iron Viz competition. When she’s not vizzing, Brittany enjoys reading, movies, concerts, taking care of her aquariums and growing plant collection, and traveling.

Candice Che

View Profile

Candice Che

Sydney, Australia
Candice Che is the Finance Data Viz Lead at Woolworths Group. She enjoys participating in Tableau community projects that serve as a medium for her artistic expression. In these instances, Candice creates artwork using tools such as Figma and Procreate, which she then uses as background images for her dashboards. Candice’s favourite part about Tableau Public is it is a canvas to present her unique take on the world. By crafting meaningful data visualizations and insights, she not only amplifies her own voice but also fosters valuable conversations. She firmly believes that a richer understanding of the world emerges when we all contribute our distinct perspectives, enabling collective growth.

Chantilly Jaggernauth

View Profile

Chantilly Jaggernauth

, United States of America
Chantilly Jaggernauth's mission is to empower corporations and individuals through the use of data visualizations and data analytics. She is a five year Tableau Visionary who specializes in data visualization, data analytics, design, and training. Currently, she is the Vice President of BI & Data Analytics at Lovelytics based in Arlington, VA. Prior to joining Lovelytics, Chantilly worked for Johnson and Johnson and Comcast. In addition to her day job, Chantilly is the founder and CEO of the non-profit organization Millennials and Data (#MAD). Through #MAD, she works to bridge the data literacy and analytical skills gap by training, mentoring, and preparing millennials to enter a data- driven global environment.

Chiaki Ishida

View Profile

Chiaki Ishida

Tokyo, Japan
Chiaki has been building a Tableau CoE at a company she works for. She is training people to use Tableau to solve business problems. She strives to make viz simple and easy to understand, but occasionally contributes complex, challenging, and playful viz. Her journey with Tableau has started since 2018. After that, she loves Tableau Public and the Tableau Community, which is always a great inspiration. So she would like to encourage more people in Japan to join.

Chimdi Nwosu

View Profile

Chimdi Nwosu

Surrey, Canada
Chimdi Nwosu is a Data Visualization Designer and Developer based in British Columbia, Canada, known for leveraging data and design to produce beautiful insights. He’s passionate about creating data-driven solutions that empower businesses with invaluable insights for informed decision-making. Outside the world of data, He's a fitness enthusiast who appreciates a good workout, a music lover who finds inspiration in melodies, and likes to eat. Chimdi channels his creative energies into Tableau, using it as a canvas to explore different data visualization approaches, while sharing them publicly on his profile so that others, too, can be inspired to learn, grow, and pursue their passions and curiosities.

CJ Mayes

View Profile

CJ Mayes

Chelmsford, United Kingdom
CJ Mayes is a Tableau Visionary and Ambassador who currently works in a director role, based in London, UK. Excited by the blend between sports and data, CJ co-authors #SportsVizSunday blogs alongside three fantastic community members. When he’s not writing about sports, you will tend to find him out running, watching football, or reading books on psychology. You can find some of his more advanced Tableau tutorials on CJ-Mayes.com.

Dennis Kao

View Profile

Dennis Kao

Ottawa, Canada
By day, Dennis is a social work professor at Carleton University, where he conducts health equity research and teaches courses on community practice, nonprofit management, and research/statistics. By night, he is an aspiring data visualization and map designer. With over a decade of experience in statistical analysis and GIS mapping, he first discovered Tableau in November 2020. Engaging with the #DataFam and participating in the various community projects has invigorated his passion for working with data.

Elisa Davis

View Profile

Elisa Davis

Reno, NV, United States of America
Elisa Davis is a 2x Tableau Ambassador, the co-lead of Back 2 Viz Basics (#B2VB) Tableau community project, and a Lead BI Analyst for Discover Financial Services. Since discovering Tableau she's found work she enjoys and a community that she loves being a part of! When she's not working, vizzing, or looking for B2VB data sets you'll find her skiing, hiking and hanging out with her family in Reno, NV.

Ellen Blackburn

View Profile

Ellen Blackburn

London, United Kingdom
Ellen is a Consulting Analyst at the Information Lab UK. She discovered Tableau and the Tableau Public community when she joined the Information Lab's Data School programme in 2018. Ellen uses Tableau Public to showcase business dashboards to help inspire others, and visualise topics she's passionate about.

Emily De Padua

View Profile

Emily De Padua

Bloomfield, United States of America
Emily De Padua is a lover of storytelling, data visualization, and people. After earning her Bachelors in classical flute performance at Rowan University and a serendipitous turf management lecture at the Philadelphia Eagles stadium, Emily forged a data career spanning industries such as Classical Music, Botanical Gardens, Sports, and Media Entertainment. Introduced to Tableau at her first Data Analytics role in 2016, Emily has the honor of being a two-time Tableau Iron Viz Competition Runner Up, placing 10th in the 2020 Iron Viz and later 7th in the 2022 Iron Viz. She was named a Tableau Public Featured Author in July 2021. Based in New Jersey, Emily is currently a Senior Data Analyst at Disney.

Eric Balash

View Profile

Eric Balash

Fairfax, United States of America
Eric Balash is a passionate data enthusiast and a 4-time Tableau Public Ambassador. His mission? He enjoys empowering others with the transformative potential of Tableau and data visualization. Eric's journey led him to establish the Tableau community project, "Back 2 Viz Basics," helping newcomers unlock the magic of data. He also manages the Tableau Student Guide Website, serving as a valuable resource for aspiring data artists. Beyond his community contributions, Eric is an essential part of the non-profit organization, Millennails and Data, where he shares his expertise as a trainer. In his professional life, Eric serves as a Senior Manager at Lovelytics, collaborating with four other ambassadors and a Tableau visionary to drive data excellence. Outside the world of data, Eric finds joy in life with his soon-to-be wife, Olivia, and their standard poodle, Loki, in the vibrant DC metro area. Together, they embark on adventures across the globe, fueled by a shared love for exploration and food. Be warned, Eric and Olivia can out-eat anyone at the dinner table – they are true culinary adventurers. Eric's mission is to make data and Tableau accessible to all, one visualization at a time.

Ervin VInzon

View Profile

Ervin VInzon

Balanga City, Philippines
Ervin Vinzon is an independent Tableau Consultant based in the Philippines, specializing in helping clients gain insights from their data through effective data visualization. He actively engages with the Tableau community, using Tableau Public to enhance his artistic skills and stay updated about data visualization best practices. He also helps other Filipinos who want to learn Tableau by leading the Manila Tableau User Group.

Etido Ekwere

View Profile

Etido Ekwere

Abuja, Nigeria
Meet Etido, a data visualization enthusiast and project management specialist with three years of Tableau expertise. He's passionate about unlocking the voice of data for social and sustainable development across institutions. Etido thrives on solving complex problems with a rational touch. In the Tableau community, he finds inspiration, learns, and shares his wealth of knowledge. Beyond his professional pursuits, you'll often find him enjoying short marathons and diving into captivating literature.

Fred Najjar

View Profile

Fred Najjar

Sydney, Australia
Fred Najjar is a Director of Business Analytics at JLL in Sydney, Australia. He is passionate about using data to drive business insights and decision-making. In his role, he leads a team of data analytics specialists in developing and implementing data-driven solutions for clients across different of industries. Fred is a highly experienced data professional with over 10 years of experience in the industry. He holds a Master's degree in Data Science from the University of Sydney and is a certified Tableau Professional. He is also a co-leads the Tableau Sydney User Group and the APAC Datafam Catch Up. Fred is a strong advocate for best practices in data analytics and is committed to promoting a collaborative and inclusive data community. He is also a frequent speaker at data conferences and events. In his spare time, Fred enjoys hiking, reading and exploring topics about politics and history using Tableau.

Gaby Bouret

View Profile

Gaby Bouret

Capital Federal, Argentina
Gabriela Bouret has a degree in Systems (CAECE), works as a project leader and is responsible for data analysis at LA NACION DATA. He has a diploma in Business Intelligence and a master's degree in Data Mining (Universidad Austral). She has been chosen as a Tableau Public Ambassador since 2017.

Gandes Goldestan

View Profile

Gandes Goldestan

Bandung City, Indonesia
Gandes discovered Tableau in 2020 and started using it with community projects in March 2021. Through Tableau Public #VOTD Gallery, she's in love with how people analyze and visualize data in a creative way. She loves scrolling #Datafam vizzes and learning about tips and techniques from them. Professionally, Gandes is a Business Intelligence Analyst based in Indonesia. Besides creating business dashboards with Tableau in her day-to-day life, Gandes is also actively involved in creating impactful vizzes using government datasets with her Data Analytics Team colleagues.

Gbolahan Adebayo

View Profile

Gbolahan Adebayo

Ibadan, Nigeria
Gbolahan Adebayo is a data visualization developer with a strong passion for turning complex data sets into clear and visually stunning insights with Tableau.They possess advanced skills in leveraging data analytics to facilitate informed decision-making and enhance operational efficiencies within organizations. Gbolahan Adebayo is characterized by their creativity, goal-oriented mindset, and exceptional problem-solving abilities. With a passion for data and a strong desire to drive positive change in the Nigerian Data Community through analytical insights as well as visualization, Gbolahan is well-prepared to excel in a diverse range of data-driven projects and roles. Their communication skills are exceptional, making them adept at conveying complex analytical findings to both technical and non-technical stakeholders. In his free time, Gbolahan likes to watch a lot of football, read about renaissance history and the looking through Pinterest for interior decor ideas.

George Koursaros

View Profile

George Koursaros

Zurich, Switzerland
George is a Data Visualization Analyst originally from the sunny island of Cyprus and now living in Switzerland. He is passionate about all things data, with a special love for data visualization, compelling data storytelling, and data art. Beyond the data realm, he loves movies, music, animals, exploring new destinations and spending time outdoors – all of which often find their way into his visualizations!

Ghafar Shah

View Profile

Ghafar Shah

Bensalem, United States of America
Ghafar Shah is a seasoned Lead Data Analyst at Comcast, where he wields the power of data to inform and shape strategic business decisions. By night, he transforms into a passionate data visualization enthusiast, crafting eye-catching visuals that bridge the realms of pop culture and business. Tableau Public serves as Ghafar's canvas of choice, allowing him to channel his creativity, connect with the data community, and draw inspiration for his work. In 2022, Ghafar had the privilege of presenting at the 2022 Tableau Conference in Las Vegas, sharing insights alongside his esteemed mentor and friend, Tableau Visionary Chantilly Jaggernauth. Together, they explored the art of creating compelling data visualization portfolios and injecting the elusive "WOW" factor into them, all with the power of Tableau Public Portfolios. Additionally, Ghafar received the prestigious Biggest Growth Vizzie Award at the 2020 Tableau Conference and has garnered four Tableau Public Viz of the Day recognitions, solidifying his reputation as a trailblazer in the field. Beyond his professional accomplishments, Ghafar enjoys his downtime, often engaging in PlayStation gaming, staying active through workouts, and unwinding with Netflix binge-watching sessions.

Idris Akilapa

View Profile

Idris Akilapa

Ibadan, Nigeria
Idris is from Nigeria ,whose initial mission was to learn Tableau for 3 months, fortunately he falls in love with Tableau and the great community which pushes him to be his best everyday, he has been using Tableau for 3years. Idris loves to help others leverage the power of Tableau to get the most out of their data, and through his work with the community projects.

Irene Diomi

View Profile

Irene Diomi

London, United Kingdom
Before becoming a consultant, Irene studied Law with business at university and did a masters in management, she then worked at American Express where she managed to get the best customer satisfaction within her team. She enjoys learning, teaching, mentoring, and sharing new techniques with the data community. She also loves exploring ideas and concepts surrounding data through her speaking engagement, she was notably a speaker at the last Tableau conference. Four of Irene’s works were selected as Tableau ‘Viz Of the Day’ for showing best practices and outstanding design. Irene has accumulated more than 100k views on her tableau public profile and her work was featured in news outlets, a gallery, and a book. She is also an active contributor to the tableau community blog where she shares her experience and knowledge. Irene worked with companies like PwC, Aldermore, and Breedon to support their analytics capabilities. Throughout her work history, Irene has taught thousands of professionals topics surrounding Tableau, Alteryx, Power Bi, data literacy, and design approach. Irene has a very user-centric approach in her work, she ensures great user experience for her product but also throughout the management of data projects. She always strives to create an outstanding experience for her colleagues and clients. Outside of work, she likes designing visualizations that express her artistic side while pushing her to explore new design techniques.

Ivett Kovacs

View Profile

Ivett Kovacs

Budapest, Hungary
Ivett has strong background and expertise in data visualization development and design. Being recognized as a Tableau Zen Master (2021 and 2022) and Public Ambassador (from 2020) shows her commitment to encouraging the community with her extraordinary way of thinking while also helping them learn the newest best practices and evergreen principles.

Jennifer Dawes

View Profile

Jennifer Dawes

Cincinnati, United States of America
Jennifer Dawes has 8 years of professional experience in data analytics. Jennifer is currently a Tableau Public Ambassador and has received the Tableau Public Viz of the Day award on eight occasions. Jennifer is passionate about elevating, educating, and empowering women in data. She is also one of the Co-Founders of HerData.net alongside her good friend, Dinushki De Livera.

Jessica Moon

View Profile

Jessica Moon

Gurley, United States of America
Jessica Moon first discovered Tableau in 2014 while working in a data science testing role. Four years ago, she transitioned to developing and has had the pleasure of working with Tableau on a daily basis ever since! Jessica is a Tableau Desktop Certified Associate and has received #VizOfTheDay five times. She participates in community challenges such as #B2VB, #IronQuest, #SportsVizSunday, and #ProjectHealthViz. Since 2019, she has created a dashboard for each season of The Bachelor, and that effort that brought her to Tableau Public. Outside of vizzing, Jessica enjoys spending time with her three young children and taking a hip hop dance class.

Johanna Josodipuro

View Profile

Johanna Josodipuro

Sydney, Australia
Johanna is a Data Analytics consultant at the Data School Down Under in Sydney, Australia. She started her Tableau Public journey after stumbling upon the #VizforSocialGood community initiative during her studies. Finding the experience fulfilling and enjoyable, she later decided to pursue a career in data analytics and has never looked back. She was later selected as Tableau Public Featured Author 2022, received a Vizzies Award at the Tableau Conference 2022 and had 2 of her vizzes featured as Viz of the Day. Her interest lies in discovering valuable insights and weaving compelling stories from data. Outside work, you can find her scrolling through Tableau Public vizzes whilst sipping tea.

Joti Gautam

View Profile

Joti Gautam

Mumbai, India
My name is Joti Gautam and I am a BI Specialist at JLL. I enjoy working with data and leveraging its power to help businesses become more efficient. My job is to make people's life easier by reducing the effort in uncovering data insights and what's better than that. My hobbies include cycling, gym workouts and painting. I currently live in Mumbai, India and would love to connect with data people.

Judit Bekker

View Profile

Judit Bekker

Berlin, Germany
Judit Bekker is a Data Analyst and Dataviz Designer based in Berlin. She believes even small data can have a big impact, that people can only grow by elevating others, and that you don't need to be the best in everything to be the best in something. Judit is obsessed with arts and design, fonts, books, movies, food, and so much more. It's safe to say there is more she's passionate about than she isn't.

Kayla Swain

View Profile

Kayla Swain

San Diego, United States of America
Kayla was first introduced to Tableau during graduate school and quickly became interested in the platform’s ability to communicate data with a compelling narrative. Working with Tableau combined a love for numbers with the opportunity to explore data in a more creative way. Kayla joined Tableau Public to help grow her design skills and enjoys participating in #Datafam community challenges. She was a 2022 Tableau Featured Author and is a 2-time recipient of Viz of the Day. Kayla is currently a Data Visualization Consultant at Lovelytics. Within her role, she enjoys crafting dashboards to meet clients’ specific needs, providing them with important insights. Outside of work, Kayla enjoys attending concerts, watching musicals, and all things music related.

Kevin Flerlage

View Profile

Kevin Flerlage

Burlington, KY, United States of America
Kevin Flerlage is a Tableau Evangelist and Data Visualization Consultant for Moxy Analytics. He has 17 years of experience building analytic tools and dashboards to provide insights, manage workflows / processes, and address issues before they become problems. Kevin is a five-time Tableau Ambassador, a four-time Tableau Visionary (a title held by less than 70 people worldwide) and the third most favorited author on Tableau Public (out of 3 million+ authors). Kevin is active in the Tableau Community and frequently blogs about Tableau on flerlagetwins.com, a site that he shares with his identical twin brother and fellow Visionary, Ken Flerlage.

Kevin Wee 黃克文

View Profile

Kevin Wee 黃克文

Chicago, United States of America
Kevin is a Featured Author who publishes vizzes with innovative designs and functions on his Tableau Public profile. His vizzes have been featured as the Viz of the Day and in the Tableau Conference Viz Gallery. He is known for his "Tableau x Figma series," showing how to create dashboards with good UI via both tools. He has presented the series in many Tableau User Group meetups. Kevin won the 2023 "Biggest Growth" Vizzies Award for his creative works and contribution to the DataFam community. Kevin has a PhD in scientific visualization evaluation. He is a Senior BI Analyst at Discover Financial Services, where he develops data tools for business analytics and provides Tableau training to employees.

Khalid Amribet

View Profile

Khalid Amribet

Casablanca, Morocco
Khalid Amribet is a Data Analyst based in Morocco. In early 2022, he discovered Tableau and was inspired by its potential to create stunning visualizations. Khalid embarked on a journey to learn Tableau and worked on community projects. When he shared his vizzs on LinkedIn and Twitter, Khalid received incredible support from the Datafam community, which motivated him to keep going. Thanks to Tableau, he transitioned from a marketing role to a data analytics role. Khalid's main goal is to introduce Tableau to people in Morocco and Africa, helping them to unlock valuable insights from their data.

Kim Tricker

View Profile

Kim Tricker

Winter Park, United States of America
Kim is a Senior Data Analyst at Cisco Meraki. After an initial encounter with Tableau while earning her Master’s Degree in Data Science and Business Analytics, she was asked to build a dashboard while working at a financial services company. From there her passion for data visualization was born, spending hours outside of work designing dashboards in Tableau Public for fun. She has since earned five Viz-of-the-Day recognitions, placed second in the North America region of the 2023 Iron Viz competition, and was named a Tableau Public Featured Author in 2020. Outside of Tableau, Kim enjoys playing tennis and travelling the world with her wife Maddie.

Kimly Scott

View Profile

Kimly Scott

Melbourne, Australia
Kimly is a Tableau Visionary, Tableau Public Ambassador, a member of the Tableau Community Equity Taskforce, co-lead for the Melbourne Tableau User Group and co-lead for Diversity in Data. She was also a global Iron Viz finalist for 2022, placing second. Kimly is based in Melbourne, Australia and uses Tableau and data visualisation to highlight topics she is passionate about such as gender equality, women’s health, diversity and refugees. Outside of data viz and work, Kimly has two young daughters who drive her passion for making the world a better and more equal place for women, girls and the underrepresented.

Kyle Yetter

View Profile

Kyle Yetter

Kennewick, WA, United States of America
Kyle Yetter is a Senior Manager of Product Analytics at Ancestry who aims to make decision making easier for the executives he works with by having the relevant data ready for them when they need it in a way that allows for actionable insight. He also works to help others in the organization improve their Tableau skills, including hosting a live Workout Wednesday session each week to share how he goes about solving the challenge and answer questions about how certain outcomes are achieved. Kyle loves being involved in the Tableau community and is a co-lead for the Workout Wednesday community initiative.

Lindsay Betzendahl

View Profile

Lindsay Betzendahl

West Chester, United States of America
Lindsay is a Partner and Senior Consultant at HealthDataViz and co-author of the book "Visualizing Health and Healthcare Data". Her passion for healthcare stems from over 20 years in the healthcare field initially as a licensed behavioral health clinician. With the desire to "tell the stories of our health", Lindsay started using Tableau 10 years ago and runs the community project #ProjectHealthViz. She is a 4x Tableau Visionary, 5x Tableau Public Ambassador, co-leader of the Virtual Healthcare TUG, 3x Vizzie award recipient, and has 13 VOTD (3 were client/work ones she designed/built). Lindsay loves creating beautiful custom dashboards that challenge what Tableau can do both technically and visually by always telling clients "anything is possible." She currently lives in Pennsylvania with her husband and two rambuncious boys. When not vizzing, she enjoys hiking, boating, spending time with family and friends, building legos, and drinking a good craft beer.

Lorela Ferhati

View Profile

Lorela Ferhati

Berlin, Germany
Lorela is a Berlin-based Business Intelligence Consultant and a creative visionary who has a profound passion for data analysis and visualization. She embarked on her Tableau Public journey in 2020, and since then, she has been devoted to crafting insights and mastering data storytelling through compelling visualizations. Immersed in the heart of #DataFam, she actively contributes to diverse community challenges, focusing on socially impactful projects. Her journey stands as a testament to her commitment to transforming raw data into actionable insights that drive decisions. She loves spending time with family and friends and also finds joy in traveling, photography, and cooking.

Lorna Brown

View Profile

Lorna Brown

Warrington, United Kingdom
Lorna is a speeding tipping magician, who loves to give back to the community. She started her journey as part of the Information Labs Data School in 2015, and now is a Data School Coach helping train the next generation of Analysts. Lorna co-leads Workout Wednesday, a community project. She also co-leads the North West UK Tableau User Group in her spare time. The community is a big part of Lorna, and she wants to do all she can to give back. Lorna is also the author of the Tableau Desktop Cookbook (2021) and she loves her cats and sports, especially Rugby League

Louis Yu

View Profile

Louis Yu

Singapore, Singapore
For many, the path of data was either focused on either analytics or engineering but what Louis really enjoyed was telling stories using data, sharing insights and teaching others how to do the same. His proudest moments was clinching 2 VOTD and making Top 15 for IronViz last year. Currently, he leads the global data visualization team at 2K Games, advocating best practices and driving data literacy company-wide. In his free time, he helps to nurture the #datafam by encouraging folks to “viz what you love” through the community project #GamesNightViz, together with Will and Tina!

Ludovic Tavernier

View Profile

Ludovic Tavernier

Maroeuil, France
Ludovic Tavernier is a Senior Data Analyst and Data Visualisation Specialist at Ledger, a web3 company developing products and services to enable individuals and companies to secure and manage crypto assets. At Ledger, He designs and builds Tableau interfaces and experiences that the end-users can trust to correctly and quickly meet their analytical needs and enhance their decision making. He supports his team in their Tableau learning journey and promotes data literacy and data culture in his organization. He has been working on data-related topics for various industries for a decade. He discovered Tableau for the first time in 2012. He was one of three participants in the Tableau IronViz competition at the 2018 Tableau Conference in New Orleans and produced the Weather Memories Dashboard in 20 minutes in front of 17,000 attendees.

Luke Abraham

View Profile

Luke Abraham

Johnston, United States of America
Luke is an Analytics Consultant at phData. He has been using Tableau for about 5 years. He uses Tableau Public as a creative outlet, drawing inspiration from exciting topics such as license plates and tomatoes. For further inspiration, he looks to the amazing content consistently put out by the #datafam. He was the 2003 Winter Formal King, as well as TC23 Data Storyteller Extraordinaire winner. His favorite color is orange.

Maureen Dzifa Awumee Quist

View Profile

Maureen Dzifa Awumee Quist

Los Angeles, United States of America
Maureen is currently a Business Analytics Professional at USC Marshall School of Business. Prior to embarking on this journey, she was a data consultant at a humanitarian organization in Afghanistan where she specialized in data analytics and visualization. She has always been keen on data and believes it and its insights are powerful and could change the world. Maureen has about three years of experience using Tableau and enjoys personal projects outside of work to build her scope of knowledge of the BI tool. She also enjoys having informal lessons on Tableau and brainstorming with colleagues and friends. Maureen aims to use her knowledge of data and her love for design in product management in the future hence a journey in a Master of Science in Business Analytics. Outside of Tableau, she likes to listen to music, dance, play video games and enjoys going on road trips. She has had the opportunity to have two of her Vizzes displayed at the Tableau Conference Viz Galleries in 2020 and 2022. She was Tableau Ambassador(2022), former Tableau Public Featured Author (2021) and has one Tableau Public #VOTD.

Mehras Abdoli

View Profile

Mehras Abdoli

United States of America
Mehras joined the DataFam in May 2022 and has been actively participating in the community through various projects. He is an #EduVizzers co-lead, a 2023 Tableau Public Featured Author, a TUG speaker, and a #VOTD creator. He is always looking for learning opportunities and loves giving back to the DataFam community. Mehras is the Director of Data Science and Visualization at Houston ISD, leading a team of analysts who transform, analyze, visualize, and advise on K-12 quantitative, qualitative, and geospatial data.

Michelle Frayman

View Profile

Michelle Frayman

Boston, United States of America
Michelle started using Tableau Public at the end of 2018 to participate in #MakeoverMonday. When she is not practicing with #MakeoverMonday, #IronQuest, or #DataFamCon she likes to viz about topics in her everyday life and engage with the data community on Twitter at @maf2k. She co-leads #VizOfficeHours, #TheFeedbackLoop and #DataFamCon and has occasionally tried to broaden her horizons by attempting to blog at My Data Continuum. Her favorite part of Tableau Public is that it is available to anyone to use. Her kids have even set up accounts to build vizzes for their Bar Mitzvah projects and she hopes they move past their love of pie charts. When not vizzing she enjoys spending time with her family cooking, skiing, camping, and playing ultimate Frisbee.

Mo Wootten

View Profile

Mo Wootten

London, United Kingdom
Mo is a Senior Analyst in the British high performance sport system. He works with Olympic and Paralympic sports to create award-winning insight projects that improve athlete health and performance. Not content with just working in sport, he also co-leads #SportsVizSunday; a Tableau-focused community that shares a passion for sport and data. Since joining the DataFam during the Covid pandemic, Mo enjoys making visualisations that extend the boundaries of what can be done with map layers and parameter actions. When not at a computer, Mo can usually be found on a badminton court or on a stage.

Murilo Cremon

View Profile

Murilo Cremon

Barueri, SP, Brazil
Murilo Cremon has been working in the data analysis area for just over 9 years and works as a Business Intelligence Specialist at Grupo Boticário, responsible for structuring the BI strategy and planning with the business areas, using Tableau and GCP to build solutions in data. Additionally, Murilo is passionate about data visualization and has a blog where he posts about Tableau and modeling solutions. His interests are exploring and creating new data visualizations in Tableau Public, helping the community with new ideas and teaching sources about simple techniques. Ultimately, he intends to help the Brazilian Tableau community grow and become a reference.

Neil Richards

View Profile

Neil Richards

Alfreton, United Kingdom
Back for my seventh term as a Tableau Public Ambassador, I love Tableau Public and continue to be proud to play this role! Also a five time Tableau Visionary/Zen Master, blogger and author (Questions in Dataviz)

Nicole Klassen

View Profile

Nicole Klassen

Atlanta, United States of America
Nicole Klassen is a data visualization developer with a passion for social science research and mental health advocacy. She combines her background in psychological research with her data viz skills to create vizzes that shine a light on societal problems such as mental health, climate change, and women's rights. Her work in the community both vizzing and co-leading the Atlanta Tableau User Group and #DataFamCon has earned her a Vizzie and 4 Viz of the Days.

Nir Smilga

View Profile

Nir Smilga

Ness Ziona, Israel
Nir Smilga is a Senior Data Visualization Engineer and Analytics Center of Excellence Lead at Zoominfo. He is passionate about data and data visualization and has been creating Tableau visualizations for over four years. This is his second year as Tableau Public Ambassador, he has been selected as a Tableau Featured Author and has seven Vizzes of the Day. Nir's visualizations focus on topics he cares about, such as music and social justice. He is an active member of the Tableau community and the #DataFam, and is always looking for ways to spread his passion for data visualization with others. Nir shares his knowledge and expertise in Tableau and data visualization through consulting, lecturing, teaching, and blogging.

Olushola Olojo

View Profile

Olushola Olojo

Hampshire, United Kingdom
Shola works as an Insight & Strategy Manager in the UK and began his Tableau journey in October 2020. He is a member of the Tableau Community Equity Taskforce and is passionate about using data to spotlight social justice issues, particularly in education. Shola actively maintains a blog and enjoys creating impactful data visualizations on Tableau Public. Outside of data, Shola competed in the Triple Jump at the UK Championships and Olympic Trials.

Pablo Gomez

View Profile

Pablo Gomez

London, United Kingdom
Originally from Argentina and living in the UK, Pablo is Tableau Public Ambassador and Tableau Visionary 2023, co-leader of #LondonTUG, co-leader of Latino TUG Comuni[Datos] and Data Visualisation Lead at the British Standards Insititution in UK. Always fascinated by Data and Graphic Design, he was introduced to Tableau in 2013 and soon it became the perfect platform to combine both of his passions. He became a Tableau Public Ambassador in 2017 and ever since, he has spoken in several TUGs, Tableau Conference and events about the importance of building a Tableau Public profile not only as a never ending source of inspiration; but also to learn and grow your dataviz skills.

Pradeep Kumar G

View Profile

Pradeep Kumar G

Erode, India
Pradeep works as a Data Visualization Lead based in India, with over five years of expertise in data visualization and business intelligence. His accomplishments include being a 3-time Tableau Public Ambassador, a 2-time Vizzie Award winner, an 11-time Viz of the Day recipient, a bronze winner at the Information is Beautiful Awards 2022, and a finalist in Iron Viz 2021. He is also the second-most favorited author on Tableau Public, with over 15k viz favorites. He is enthusiastic about exploring and experimenting with the latest UI/UX design trends using Tableau and Figma. When he's not immersed in vizzing, he enjoys spending time with family and friends, traveling, and watching sci-fi movies.

Preethi Lodha

View Profile

Preethi Lodha

Boston, United States of America
Preethi Lodha is a highly accomplished Data Analytics and Insights Manager in Higher Education, specializing in data visualization and Tableau. She excels in transforming complex data into compelling visual stories, significantly impacting analytics. As a Tableau Public Ambassador and Featured Author, Preethi has showcased her talent and expertise to a global audience. Preethi's work has gained global recognition, with over a million views for her visualizations. Beyond her creations, she actively contributes to the Tableau community. She co-leads the Tableau community project #DataFamCon, Tableau Public User Group and serves on the Instructor Advisory Council for #TableauforTeaching, emphasizing her dedication to knowledge sharing and empowering others. Among her accolades, Preethi is the Women in Analytics Data Visualization Winner. Additionally, she holds the Tableau Desktop Certified Associate certification, highlighting her mastery of Tableau software. Through her Tableau Public profile, Preethi shares her knowledge and insights with the broader community. Her visualizations cover various topics, including industry data, social issues, and personal projects. By sharing her work, Preethi aims to inspire and empower others to harness the power of data visualization. With her commitment to excellence and pushing the boundaries of data visualization, Preethi Lodha continues to make a significant impact in the field, driving innovation in data analysis.

Priya Padham

View Profile

Priya Padham

London, United Kingdom
Priya is a Data Visualisation Engineer II at Expedia Group and has been an active community member since early 2020. Later that year, she became a Tableau Featured Author and Tableau Public Ambassador, as well as receiving a community award at the Tableau Conference. She also recently became a Tableau Visionary for the first time in the 2023 cohort. She loves experimenting with design and visualising data about her interests, such as her favourite music and movies. The #DataFam community is so inspiring and full of incredible people, and she loves connecting with members all over the world who share a passion for data.

Priyanka Dobhal

View Profile

Priyanka Dobhal

Toronto, Canada
Priyanka is a Technical Lead at USEReady and has been an active community member since 2018. Tableau public is like a blank canvas for her to paint and her favorite part about using it is the ability to share and learn from the #DataFam community. She believes in "Vizing what you love" and enjoys creating visualizations on topics such as movies, music, and sports. She also likes to participate in community projects and credits her learning and growth to the community. When not vizzing, she enjoys spending time with her family and friends, cooking, reading books, and playing video games.

Ravi Mistry

View Profile

Ravi Mistry

Manchester, United Kingdom
After discovering Tableau in 2015, Ravi used it to supercharge his blogs about football analytics by using publicly available data to share visualisations on Tableau Public. After spending 5 years at The Information Lab UK, Ravi moved into his dream role at the City Football Group, where he helps teams make better decisions faster by reducing time to insight. Ravi is fully certified in both Desktop & Server, and a big evangelist for both Tableau Public & the Tableau Blueprint - always thinking about future trends in data literacy & visualistion.

Rosario Gauna

View Profile

Rosario Gauna

Monterrey, Mexico
Rosario is a seasoned professional in the realm of Data Analysis and BI, with an outstanding career at Tec de Monterrey, Mexico's largest private university. Her deep passion for Tableau has positioned her as a prominent figure within the #WorkoutWednesday and #Preppin'Data communities, which are committed to enhancing technical proficiency in Tableau and Tableau Prep. She consistently engages in the pursuit of innovative approaches to maximize Tableau's potential and shares her discoveries through her blog, with the goal of giving back to the community and supporting the next generations of Tableau enthusiasts.

Sarah Bartlett

View Profile

Sarah Bartlett

London, United Kingdom
Sarah has been working in analytics for over 10 years and is passionate about internal community building and user enablement. Most recently, she co-led an internal Tableau Centre of Excellence team, supporting thousands of Tableau users through training and enablement activities. Introduced to Tableau in late 2014, Sarah soon discovered her passion for data visualisation and design through participating in various community initiatives including Makeover Monday and Viz For Social Good. In 2018, she competed on stage in Iron Viz Europe and the experience prompted her to launch Iron Quest, a community data visualisation initiative designed to prepare individuals for the Iron Viz feeder competitions. Sarah is currently a Tableau Visionary, co-leads the London Tableau User Group, mentors early career professionals, and shares content on her blog; sarahlovesdata.co.uk. In her spare time, she enjoys spending time outdoors, ideally hiking or exploring new destinations across the globe.

Satoshi Ganeko

View Profile

Satoshi Ganeko

Tokyo, Japan
I have been using Tableau from 2014. My first viz for Tableau Public was in 2018 and this year (2023) my vizzes reached 500. My theme of publishing vizzes on Tableau Public is to convey possibility and wonderfulness of Tableau. I hope you can feel it through exploring my Tableau Public vizzes. Lastly, I greatly appreciate datafam for suggesting me as Tableau Public Ambassador.

Saverio Rocchetti

View Profile

Saverio Rocchetti

Roma, Italy
Saverio is a Data Analyst Consultant at The Information Lab. Saverio enjoys using Tableau to create engaging visualizations, which highlights issues around diversity, equity, and awareness. He is also a co-lead for tableau community initiative, #DiversityinData and #DataSuperStar. 2x Tableau Public Ambassador and former Tableau Public Featured Author. Outside of Tableau he enjoys the outdoors and travel.

Seoyeon Jun

View Profile

Seoyeon Jun

Seoul, South Korea
Hello, I'm Seoyeon, the founder of 'vizable,' the first BI community in South Korea. My mission is to bridge the gap in data literacy and visualization skills throughout South Korea by fostering active engagement within the BI community. My main area of interest is Marketing Analytics, and I aspire to create data visualizations that seamlessly blend functionality, aesthetics, and actionable business insights. I love supporting the Tableau Community by spreading knowledge. You can find some BI tutorial posts on the Medium blog, and my data visualization portfolio on Instagram and Twitter (@tableau_viz). In my free time, I enjoy composing jazz music (@jazzpiano_shanny). I also love playing the piano, or immersing myself in books in the quiet corner of the Seoul library.

Shaheen Arshiya

View Profile

Shaheen Arshiya

Dubai, United Arab Emirates
I am Shaheen Arshiya, I am a BI analyst at JLL, Dubai. I am originally from India. I was introduced to tableau in 2020, by my father, and fell in love with the idea of visualizing data using tableau. I started learning tableau through their e-learning course. Then started participating in various community projects such as makeover Monday and Workout Wednesday. I loved posting my vizzes and connecting to the datafam community. I like to visualize data in a way that would make it very simple for the user to better understand the data and make actionable insights out of it. The best part about doing tableau is vizzing about topics that I am passionate about.

Shazeera Ahmad Zawawi

View Profile

Shazeera Ahmad Zawawi

Rolle, Vaud, Switzerland
Shazeera is a lawyer by training, a human rights advocate, and a self-taught comic artist. Currently a Data Analyst at Swissquote, she fell in love with Tableau in 2021 after realising that the platform enables her to combine her passion for data, visual storytelling, and drawing. She enjoys vizzing about human rights, social justice, mental health, culture, South East Asian folklore, and any unconventional topics that deserve more public interest or attention. She is on a mission to cultivate hope and curiosity in the world - one viz at a time.

Takafumi Shukuya

View Profile

Takafumi Shukuya

Tokyo, Japan
Takafumi Shukuya is a BI Consultant at NTT DATA Japan. Takafumi started posting viz on Tableau Public in September 2019 and has been posting viz every week since then. He loves simple and effective design and enjoys creating data visualizations in Tableau every week.

Tamás Varga

View Profile

Tamás Varga

Budapest, Hungary
My name is Tamás Varga and I'm a data visualization expert and team lead of the data visualization team at Starschema. I've got in touch with the Tableau community in 2019 and I instantly fell in love with it. Since then I've been actively participating in community initiatives like Makeover Monday and Back to Viz Basics. My main fields of interest are UX and UI design - how to create data visaulizations and dashboards that are highly functional, aesthetically pleasing and bring value to the people, incorporating best pratices and also pushing the limits of a given dashboard's capabilities to turn data into insights. In my private life I'm a father of two beautiful, cheerful kids and the world's most anti-social cat. In my free time I love to make music, sing and play guitar, go hiking or running, or just sit down with a good science fiction or fantasy book.

Tina Covelli

View Profile

Tina Covelli

Baltimore, United States of America
Tina Covelli works as a Senior Manager in the Asset Management industry by day and is a freelance graphic designer by night. She has a Master's from Maryland Institute College of Art (MICA) in Data Analytics and Visualization and her design style strives to inspire and fuel passion for others. Tina is most commonly known in the Tableau #datafam for her work as a Washington D.C. Tableau User Group Co-Lead and #GamesNightViz Community project Co-Host. Tina's most commonly designed topics focus on media, video games, and baseball. She is known for her design style, featuring a combination of bespoke backgrounds and layouts, coupled with her Tableau visualizations. Tina received acclaim as a 2022 IIB Long-List nominee for her 'Music is My Medicine' visualization.

Tobi Babatunde-Williams

View Profile

Tobi Babatunde-Williams

FCT Abuja, Nigeria
As of September 2023, Tobi continues his journey with boundless enthusiasm. He's dedicated to empowering millions of professionals and students through resagratia.com, a platform aimed at democratizing data analytics skills, to grow their data portfolio with Tableau. When not designing data products and crafting educational content, he enjoys the company of friends, brilliant minds, painting, and travelling . Tobi's love for Tableau has deepened, making him a passionate advocate for visual analytics and dashboard design. A true multipotentialite with an unwavering growth mindset, he remains committed to high-impact projects that transform lives.

Varun Jain

View Profile

Varun Jain

Dubai, United Arab Emirates
Varun is a Data Analyst and Data Visualization nerd based out of Dubai. He started his Tableau journey in October 2021 and joined the Tableau Community soon after. As an avid admirer of thoughtful design, UX, and the power of data, he uses Tableau both at work and in his personal projects to tell stories with data. As a result, you can always find him creating and sharing vizzes on Twitter and Tableau Public, contributing to community projects, or just making fun and silly vizzes. Varun is a Tableau Public Featured Author, a 4-time #VizOfTheDay winner, and the runner-up in the 2023 Iron Viz Global Qualifiers from the APAC region. When he is not working on his 'next viz idea,' you can find him neck-deep in a fantasy or sci-fi book, or wrecking his fingers (and brain) trying to learn piano.

Vinodh Kumar V R

View Profile

Vinodh Kumar V R

Chennai, India
Vinodh Kumar V R (VK) is a 2xTableau Visionary , 3xTableau Public Ambassador and a Tableau Public Featured Author. He is a co-lead of various community initiatives like #TheSDGVizProject , #Mentoringmeetup , #VizConnect , #Viz2Educate and #Viz4climateAction . He is also the leader of #ChennaiTUG and #MarketResearchTUG .He is a long-time active social worker, avid supporter of the SDGs and an advocate for sustainable finance. He loves maps and spatial analysis and is always in search of hidden secrets in data that can help change the world. He is a Data visualization evangelist and strives to onboard more students into data viz journey from India and its neighbouring countries.

Wendy Shijia 汪士佳

View Profile

Wendy Shijia 汪士佳

Shanghai, China
Wendy Shijia is a data visualization designer based in Shanghai, China. She has over ten years of experience in UX/UI design. As a freelancer, she is always learning new skills to stay competitive and up-to-date. Wendy started using Tableau at the end of 2018 through a training program. She quickly discovered her passion for data visualization. Since then, Wendy has devoted most of her time after work to personal projects and engagement with the Tableau community. She regularly shares her work on Tableau Public, aiming to communicate visual stories to the community about topics she finds interesting and/or important in her daily life. In early 2021, Wendy began working as a data visualization designer, with the goal of supporting clients by leveraging her passion and design experience to transform data into insights.

Whitney Wood

View Profile

Whitney Wood

Dallas, United States of America
Whitney is a Principal Analyst at LiveRamp who began using Tableau Public in early 2019. She was immediately captivated by the fun and rewarding nature of creating visualizations outside of work. She has a passion for designing artistic and uncommon charts in Tableau Public that focus on many topics spanning animals to weather and has received #VizOfTheDay three times. Whitney lives in Texas with her husband and two cats. When not vizzing, she enjoys drumming, playing video games, and attending concerts in her free time.

Will Sutton

View Profile

Will Sutton

Cambridge, United Kingdom
Will is a Consultant at The Information Lab, he's been using Tableau since 2014 and after seeing the amazing work from the community on Tableau Public he was inspired to develop his data skills further, regularly participating in community projects like #PreppinData, #RWFD, #IronQuest. He put those skills at Tableau Conference 2022 and became an Iron Viz champion. Now he co-hosts the community initiative #GamesNightViz, which is a monthly data viz, prep and design challenge featuring data from all types of games.

Yusuke Nakanishi

View Profile

Yusuke Nakanishi

Osaka, Japan
Yusuke Nakanishi is the Section Chief at a telecommunications company in Osaka, Japan, where he wears multiple hats as a data analyst, data scientist, and also oversees the maintenance and operation of the data analytics infrastructure. Active in the Tableau community, he showcases his work in #MakeoverMonday and #WorkoutWednesday on Tableau Public. He hosts a weekly X(Twitter) Space, Viz-Talk (#Vizトーク), discussing Tableau topics and sharing tips. His engagement in the community, along with the activities of others, not only establishes him as a valuable asset in the data analytics field but also serves as a constant source of skill enhancement and motivation for his own growth.

Yuta Sakai

View Profile

Yuta Sakai

Osaka, Japan
Yuta Sakai is a data consultant working in the sales department of a telecommunications company. He mainly supports the use of data with a focus on Tableau. He provides consulting services for data utilization, dashboard creation, and training for technical proficiency. He has been using Tableau for about 7 years, but first met the Tableau community at the DATA Saber Bootcamp 4 years ago. From there, he became fascinated with the community and started creating viz on a daily basis. Now his biggest hobby is Tableau. He hopes to use the power of design to create Viz that will bring new insights to people. These days he spends most of his time camping with his wife and two kids.

Zach Bowders

View Profile

Zach Bowders

Collierville, United States of America
Zach is a strong advocate for doing what you love. From vizzes dissecting pop culture hits to his award-winning Data+Love podcast or his time spent encouraging and supporting others, his love for data and the community surrounding it is clear. His efforts have made him a 2-time Vizzie Award winner, 9-time VOTD recipient, and a 3-time Tableau Visionary. Zach brings this passion to his daily professional work as a BI Specialist at JLL.

Zainab Ayodimeji

View Profile

Zainab Ayodimeji

London, United Kingdom
Zainab Ayodimeji is an experienced data scientist with a strong affinity for data visualisation. Currently based in London, UK and working for audio streaming platform Spotify, Zainab enjoys employing visual analytics to answer data questions either at work or creatively for personal projects. Many of her works have been highlighted as tableau "Viz of the day" and featured on sites like work as been featured on sites like Visual Capitalist, Analytics Vidhya, and United Nations' FAO. When she's not working, she is probably attending a music concert, watching food shows or playing video games.

Tableau Academic Ambassadors

Academic Ambassadors are Tableau champions in higher education who empower and inspire others to acquire fundamental skills to improve their employability. Student Ambassadors support Tableau Academic Programs through on-campus events and social media campaigns to prepare students for success in today’s data-driven world. Instructor Ambassadors are the guiding light for other educators to get inspired by and to support and advise and innovate the Academic Programs with us.


Abhilash P Tawade

View Profile

Abhilash P Tawade

, India
Abhilash is currently pursuing an International Master in Business at SDA Bocconi Asia Center, Mumbai. Throughout his course, he has been introduced to Tableau several times, as data visualization has become a crucial part of business management. Abhilash is particularly interested in how data visualization can help managers make informed decisions and drive organizational transformation. As a Tableau Ambassador, he aspires to make data visualization accessible to everyone. Apart from his studies, Abhilash served as the Vice President Membership at his college Toastmasters club for 1 year, where he enjoyed inspiring and encouraging others. In his leisure time, he likes to play video games.

Alicja Foksinska Arnold

View Profile

Alicja Foksinska Arnold

Birmingham, United States of America
Alicja Foksinska Arnold, CISA, CFE, is a Supervisor of Internal Audit Data Analytics at Protective Life Corporation. Alicja is also an instructor at The University of Alabama at Birmingham (UAB), where she teaches classes in accounting information systems and data visualization for business. Most recently, Alicja co-authored Wiley’s Accounting Information Systems: Connecting Careers, Systems, and Analytics. Alicja is a recipient of “Outstanding Chapter Leadership Award” from the Institute of Internal Auditors - Birmingham Chapter, a recipient of the UAB Rising Star Award, a Birmingham Business Journal NextGEN in Accounting Honoree, and an Alumna of the Decade (2010-2020) awarded by the UAB Collat School of Business. As an immigrant from Poland, Alicja enjoys celebrating her Polish culture. She is also passionate about raising awareness and advocating for individuals with Down syndrome.

Allen Hillery

View Profile

Allen Hillery

New York, United States of America
Allen Hillery is a data storyteller, educator, writer and researcher. He has over 20 years experience driving insights for marketing and sales organizations. He is an adjunct lecturer at The City College of New York and Macaulay Honors College. Allen has been studying the data visualizations of W.E.B. Du Bois for the past six years. He is the co-founder of the social media project The #DuBoisChallenge. The challenge celebrates the data visualizations of Du Bois by having participants recreate his iconic visualizations and share across Twitter. Allen and team has been extremely successful in creating an online community that shares and critiques their work. Allen is the Co-Founder of Be Data Lit; a resource for data literacy advocates to support their organizations.

Amy A. Lavin

View Profile

Amy A. Lavin

West Chester, PA, United States of America
Dr Amy A. Lavin is an Associate Professor of Management Information Systems at the Fox School of Business at Temple University. At Fox, Amy teaches courses at the undergraduate, graduate and executive level on information systems and data analytics, user experience and business intelligence. Amy serves as a faculty fellow for both the Fox School and the Business Honors Program and has won several teaching awards in both face-to-face and online classes. In addition to teaching, Amy has written several case studies and articles around digital business models, online education, nonprofits and data analytics. Prior to joining Fox, Amy spent years implementing technology across North America, assisting clients with process analysis, redesign and deployment. Amy completed her Ed.D in education administration, from Temple University’s College of Education in 2019. She earned her Master of Business Administration and Bachelor of Business Administration degrees from the Fox School. She also holds a direct marketing certificate from The Pennsylvania State University.

Antoine Dinimant

View Profile

Antoine Dinimant

Paris, France
Antoine is a freelance BI architect, working as a consultant and a trainer. He is also a lecturer for various engineering schools in Paris and teaches databases, BI and data viz. A long time ago, he graduated in Political Science and Journalism, then dropped out to the world of data. He is the author of three books in French: a MySQL handbook, an Essbase bible, and a noir short story. After SQL, regexes, BO and Essbase, Tableau is his latest technological crush. You can come across him on Tableau forums, where he often lurks for new adventures.

Benjamin Akinmoyeje

View Profile

Benjamin Akinmoyeje

Windhoek, Namibia
I am Benjamin Akinmoyeje a PhD Research student at the Namibia University of Science and Technology. I am currently conducting qualitative research in Informatics. I have had my previous work experience managing systems supporting public health data in Nigeria and a few other African countries. I am passionate about developing my skills in data storytelling and data literacy. I also enjoy traveling and landscape photography.

Bertram Goh

View Profile

Bertram Goh

Singapore, Singapore
Hello! I'm Bertram, a passionate educator and data enthusiast, proudly serving as a Lecturer at Republic Polytechnic in Singapore. I teach Data Analytics, Visualisation, and Statistics, equipping students with the skills and knowledge needed to navigate and derive insights from complex, real-world datasets. I was exposed to Tableau a few years ago when I was working as a data analyst, and it is no turning back since then. Now, my mission is to empower the next generation of data professionals. As an advocate of lifelong learning, I believe anyone - young to old - can pick up data literacy skills to empower them in their school, work, and personal life. As a Tableau Academic Instructor Ambassador, I hope to share my passion for Data with everyone whom I'm privileged to connect with.

Bhumika Arora

View Profile

Bhumika Arora

London, United Kingdom
Bhumika Arora is a currently pursuing Masters in Strategic Marketing at Imperial College London with 3 years of experience as a professional Digital Marketer. She founded a Digital Marketing Agency and specializes in growing a brands presence through social media channels and performance marketing.

Catherine Baulamon

View Profile

Catherine Baulamon

London, United Kingdom
Catherine Baulamon is an investment manager with experience in convertible bonds and credit. She is the founder of investment research company BlackRobin Group. She pursues postgraduate studies in astrobiology at Birkbeck College, London, in her spare time.

Chi Cai

View Profile

Chi Cai

Saskatoon, Canada
Hi there! My name is Chi and I am a 4th year university student pursuing an Honours Degree in Computer Science at the University of Saskatchewan, Canada. I take pride in being a data enthusiast who always pushes my limits to learn new things revolving around the world of data (such as machine learning, deep learning, data visualization tools, etc.) and create an impact from it. For the past year and a half, I worked as a Business Intelligence Analyst at Cameco, from which my interest in the data world grew extensively. I'm looking forward to the journey ahead as a Tableau Academic Ambassador and connecting with new people!

Danish shaikh

View Profile

Danish shaikh

Mumbai, India
I'm Danish Shaikh, a dynamic individual who thrives at the intersection of technology, leadership, and innovation. Currently serving as the Chairperson at IEEE-MHSSCE, I've been an integral part of leading tech-driven initiatives that foster innovation and knowledge sharing. With roles as a Google Developer Student Club Lead and Google Cloud Facilitator, I've leveraged my skills to empower others in the tech ecosystem. My global impact extended as I proudly represented The Ohio State University-USA as a Global Ambassador, establishing connections and nurturing cross-cultural collaboration. As an Ambassador for IEEE-PES Day and IEEE Smart Cities, I've showcased my leadership prowess by advocating advancements in power engineering and urban technologies. Further amplifying my influence, I've championed the spirit of entrepreneurship as an Ambassador for prestigious institutions like IIT Bombay, IIT Kanpur, and IIM Bangalore. As a seasoned Front-End Developer with two years of training experience, I've honed my technical acumen while mentoring aspiring talents. My extensive network spans industries, having represented esteemed names such as iFortis Worldwide, TechGig, Coding Ninjas, and Emertxe. With a diverse portfolio of accomplishments, I'm driven by my commitment to driving positive change, fostering innovation, and making a lasting impact in the world of technology.

Diaz Prasetyo

View Profile

Diaz Prasetyo

Sydney, Australia
I am a data professional with a strong engineering foundation and a successful transition into data analytics and data science, currently pursuing Master of Data Science at The University of Sydney. With expertise in leveraging data-driven methodologies, I excel in delivering actionable insights and solutions that improve technological operations and optimize decision-making processes. I thrive on extracting valuable insights from diverse datasets using tools like Python, R, and SQL. Additionally, I have hands-on experience in data visualization with Tableau, Metabase, and Apache Superset. Passionate about making a positive impact through data-driven innovations, I've contributed to projects spanning various industries, from startups to government initiatives.

Divesh Iyyapan S

View Profile

Divesh Iyyapan S

Karur, India
Divesh is a dedicated, determined and enthusiastic fellow who loves to lead and inspire others. From his childhood, he has been in the top five percent of students in academics and co-curricular activities. He was selected as Microsoft Learn Student Ambassador, Tableau Student Ambassador and Google Developer Student Club Lead for his college. He won in more than forty events organised by various educational institutions across India, which includes both technical and non-technical events during his undergraduate. He is currently looking for opportunities to expand his knowledge and skills in the domain of data science.

Doc Kevin Lee Elder

View Profile

Doc Kevin Lee Elder

Ruston, United States of America
Doc Kevin Lee Elder is a Research Professor of Analytics at Louisiana Tech University, the Bulldogs. He is a double Bulldog Alumni with his BS & MS from Fresno State. He is a Wildcat with his PhD from the University of Arizona. Doc has 35+ yrs experience teaching courses in IS, MIS, IT, CS, Mgt, Bus. Admin, Finance, HR, & Accounting. He has published more than 50+ papers in Journals and Conference Proceedings around the world. 5 years as the Americas Lead for Viz for Social Good hackathons in the USA & around the world! Has Presented at 50+ academic conferences as well as SAP Conferences, along with the Tableau FringeFest 3 times & Tableau Conference in 2022 & 23. Ask him about Analytics Fluency & being color deficient!

Donabel Santos

View Profile

Donabel Santos

Vancouver, Canada
Donabel's first impression of Tableau: magic. It's magic in how it made data easier to understand, and more fun to work with. She still thinks so (and even more so) to this day. Donabel is the Associate Director, Business Intelligence at the University of British Columbia (UBC), instructor at the British Columbia Institute of Technology (BCIT), and principal at QueryWorks Solutions, a Vancouver-based consulting and training company. Lately, she has been trying her hand on content creation, and has created Tableau tutorials in her sqlbelle YouTube channel (https://www.youtube.com/c/sqlbelle). She is grateful to the Tableau community for the amazing support, inspiration and collaboration.

Dr. Emre Yetgin

View Profile

Dr. Emre Yetgin

Lawrenceville, NJ, United States of America
Dr. Emre Yetgin is an Associate Professor and the Director of the Center for Business Analytics at Rider University. His main teaching interests are in Business Data Analytics, Data Visualization, and Management Information Systems. His current research spans the fields of business analytics, computer-aided decision making, human-computer interaction, and computer-mediated communication. Dr. Yetgin’s research has been published in MIS Quarterly, AIS Transactions on Human–Computer Interaction, AIS Transactions on Replication Research, Computational and Mathematical Organization Theory, International Journal of Business Research, and London School of Economics Business Review.

Dr. John F. Tripp

View Profile

Dr. John F. Tripp

Greenville, SC, United States of America
John Tripp is an Assistant Professor at Clemson University and a Visiting Professor at the Indian School of Business. Dr. Tripp has been using Tableau to teach Data Visualization since 2013, teaching more than 2,500 university students. In addition, he has delivered multiple data visualization workshops, seminars, and keynote speeches to federal and state governmental organizations, as well as at other major US universities. Before beginning his academic career, Dr. Tripp worked for over 15 years as a software developer and IT Director. John lives near Greenville, SC, with his wife and whichever of his eight kids are still living at home.

Dr. Vibhanshu Shekhar

View Profile

Dr. Vibhanshu Shekhar

Mc Lean, United States of America
Dr. Vibhanshu Shekhar is an Adjunct Professorial Lecturer at the College of Arts and Sciences, American University in Washington, D.C. His writings have appeared in various international journals, newsmagazines, newspapers, and websites of various think tanks across the world. His areas of research include emerging Asian markets, new and emerging technologies, the geopolitics of the Indo-Pacific region and ASEAN regionalism. He is passionate about the application of data analytics in international relations and area studies. Dr. Shekhar holds a Ph.D. from Jawaharlal Nehru University, New Delhi, India, and M.A. from Johns Hopkins University, Washington, D.C.

Dr Elena Fitkov-Norris

View Profile

Dr Elena Fitkov-Norris

London, United Kingdom
Dr Elena Fitkov-Norris, is an Associate Professor in Data Science and AI at Kingston Business School, Kingston University, London, UK. Over the last two decades, she has empowered countless students, introducing them to data analytics and nurturing their confidence. More recently, she has had the privilege to share with them the transformative power of Tableau, along with its advanced visualization and analytical capabilities. Dr Fitkov-Norris's research focuses on AI in decision-making, employing advanced data science techniques, neural networks and machine learning in various projects modelling customer and student behaviour. Currently, she is exploring the capabilities of Causal AI to minimize bias in observational data to enable us to accurately predict the impact of interventions and as a tool to enhance corporate foresight and innovation.

Ezenwa Victory Chibuikem

View Profile

Ezenwa Victory Chibuikem

Owerri, Nigeria
Victory is currently an undergraduate student at the Federal University of Technology Owerri pursuing a Bachelor's Degree in Electrical and Electronic Engineering, majoring in Computer and Electronic Engineering. As someone who has always disliked leaving decision-making to chance, It just made so much sense for his passion to be found in exploring big data for actionable insights. He loves using Tableau to make visualizations that create awareness of the true causes of events and loves to volunteer his data skills to help out his community. He has 1 year of internship experience as a data scientist and He can't wait to contribute to the Tableau community. You will find him singing and playing the piano when He is not exploring data.

Fernanda Jacob

View Profile

Fernanda Jacob

Jau, Brazil
Hello, you can call me Feh. Brazilian, passionate about data analysis and process automation. I'm a developer at R3 and I want to contribute to companies having a data culture.

Grace Bahng

View Profile

Grace Bahng

Los Angeles, United States of America
Grace Bahng is the Vice Dean for Undergraduate Programs and Professor (Teaching) at the Sol Price School of Public Policy at the University of Southern California. Bahng’s teaching interests focus on policy analysis, data visualization, client-based policy research, and public ethics. As Vice Dean, she collaborates with various departments and undergraduate programs to enhance the quality of curriculum and classroom instruction, experiential learning, and professional development. Previously, she has served on Tableau’s Teaching Advisory Council, directed two non-profit internship programs, and worked as a consultant with organizations, such as First 5 LA, LA County Department of Mental Health, and World Vision International. Bahng was previously a Professor at Azusa Pacific University teaching about global issues, international development, humanitarian emergencies, and community development for 10 years. Bahng holds a Ph.D. in Policy, Planning, and Development from the University of Southern California, a Master of Public Policy (MPP) from the University of Southern California, a B.S. in Computer Science at the Massachusetts Institute of Technology (MIT), and an M.Div from Fuller Theological Seminary. She received the Henry Reining, Jr. Dissertation Award for her research on microfinance provision for caregivers of vulnerable children in Ethiopia and has worked with a variety of organizations throughout her career, including technology start-ups, urban youth organizations, community development organizations, microfinance institutions, local churches, and research institutions throughout her career.

Grace Gong

View Profile

Grace Gong

Toronto, Canada
Grace is a computer science student at Western and a software engineer intern. She is based in the Greater Toronto Area and has interests in product development, data analytics, and community organizing. She was an Major League Hacking Top 50 Hacker, recognized for her leadership and technical projects, is the Developer Student Club Lead at Western, leads the Google Developer Group and MongoDB User Group in Toronto. She started a women in computer science community group at Western.

Ian Cedric Io

View Profile

Ian Cedric Io

Singapore, Singapore
Cedric is pursuing business analytics at Nanyang Technological University, Singapore and is passionate about driving analytics-led business decisions in supply chain and procurement. He started vizzing on Tableau Public in 2022 and has participated in community-led challenges like #VizForSocialGood and #EduVizzers. He was also Tableau Public Featured Author 2023. He is constantly sharing his vizzes and providing feedback to members who are new to Tableau Public and credits the DataFam for his development in Tableau.

Jason Davidson

View Profile

Jason Davidson

Indianapolis, United States of America
Dr. Jason Davidson is an Assistant Professor in the Lacy School of Business, where he teaches Data Analysis and Business Modeling, Business Intelligence, Data Network Engineering, and introductory management information system courses. With a background in media development, prior to joining the faculty at Butler, he worked in the technical publishing industry. Along with teaching, he currently serves as an IT consultant for regional businesses in the Indianapolis area, is currently serving as the Vice President of the Association of Technology Management and Applied Engineering EECT division, and the Vice President of Technology for the Mid-West Decision Science Institute. He holds a B.A. in telecommunication arts from Butler University, an M.B.A. from Morehead State University, and Ph.D. in technology management and engineering from Indiana State University. He was the recipient of the 2018 Lacy school of business Dean’s Teaching award, 2023 Experiential teaching award, and was the 22-23 outstanding professor of the year. He lives in Indianapolis, IN. with his wife Sarah and Son Miles.

Joalin Soh

View Profile

Joalin Soh

Singapore, Singapore
Joalin is a Final Year undergraduate at Singapore Management University, pursuing a Bachelor of Business Management, Operations Management Major. Her passion for Tableau began after attending an Introductory Tableau workshop, which allowed her to recognise how user-friendly and recognised Tableau is in the Operations Industry. Besides that, Joalin believes in the importance of going the extra mile for others! She enjoys collaborating with others through events, community service and more.

Johan Louw

View Profile

Johan Louw

Stellenbosch, South Africa
Johan holds the position of Associate Professor in the domain of Logistics- and Supply Chain Management at the Department of Logistics; Stellenbosch University (South Africa). Apart from providing teaching and learning in this field of study at undergraduate and focused modules at postgraduate level, he is also responsible for research supervision of students’ postgraduate research and subject-related research and publishing. Prior to entering academia, Johan held various positions in the Petrochemical Industry. He originally graduated as an Industrial Engineer and later completed his MBA. He also completed his PhD in Logistics related to Advanced Supply Chain Planning. Johan gained extensive experience and recognition in this industry in numerous positions held related to, amongst others, Industrial Engineering (General), Maintenance Engineering (Mechanical), Engineering & Performance Enhancement (Process), Production Management & Planning, Business Development, Supply Chain Strategy & Implementation, Supply Chain Network Design & Configuration, Supply Chain Planning, People Competency Development, and Supply Chain Performance Management. His attention is now specifically focused on the field of Packaging Logistics, Warehouse Operations Management, Inventory Planning and Management, and Visual Supply Chain Data Analysis.

Jona Shikonga

View Profile

Jona Shikonga

Windhoek, Namibia
Jona is a IT Technician with 3 months experience for Malala Gaming Namibia. Jona oversees the IT department, as well as maintaining IT equipment's, fixing and trouble shooting IT components issues. Jona hold a Bachelor Degree in Informatics from Namibia University of Science and Technology. He is currently completing his Certificate in Python (Advance Level) from Namibia University of Science and Technology. Jona is a data analysis enthusiasm and he enjoys telling story with data through report building as well dashboard. He believes data is an oil for every organization, and should be analyzed to extract meaningful insight that can drive business decision.

José Mancera

View Profile

José Mancera

Zurich / Luzern, Switzerland
José A. Mancera works at Beekeeper AG in Zurich as a Software Engineer and Applied Data Science Researcher at the University of Applied Sciences in Luzern (HSLU) as a lecturer. He is also pursuing a Ph.D. at the Human-Ist Institute in the field of Soft-Computing in Fribourg. His research interests include recommender systems, fuzzy mathematics, explainable AI (XAI), and generative AI. Mr. Mancera earned an M.A. in Information Management and an M.Sc. in Computer Science at the University of Fribourg and the University of Bern, respectively, with magna cum laude (Honors). He has a series of journal and articles publications at several international conferences in the fields of machine learning and computer science. From 2016 to 2018, he worked as Senior Big Data Machine Learning Scientist at the Information System Research Group at the University of Fribourg. In 2016, he worked as a Data Scientist at Schindler Aufzüge AG in the New Technologies department, where he researched machine learning, sensor networks, and big data. During this time, he patented an algorithm for proprietary technology. In 2013, he worked as a research assistant at the Swiss Space Center at EPFL and collaborated in developing CDMS satellite software. While at EPFL, he also earned a minor in space technologies. His working experience covers different industries: aerospace, fintech, robotics, social networks, and telecom. Other companies and public institutions have hired him, such as HSLU, Beekeeper AG, CreditGate24, Swiss Space Systems, ELCA Informatik, Nortel Networks, Huawei Technologies, and Televisa SA de CV in Mexico, USA, Canada, and Switzerland. In 2006 he obtained a B.Sc. in Electronics and Communications from the Monterrey Institute of Technology (ITESM), Mexico City.

JP Kelly

View Profile

JP Kelly

London, United Kingdom
I am a senior lecturer in Television and Digital Media at Royal Holloway, University of London, where I have taught since 2013. I was awarded a PhD from the University of Nottingham in 2011 and completed a Masters in Film Studies at UCL in 2007. I am the author of "Time, Technology and Narrative Form in Contemporary US Television Drama" (Palgrave, 2017) and have published several journal articles examining the role of data in the television industry. I utilise data visualisation extensively within my research and teaching, and see Tableau as an integral tool for discovering new insights and disseminating my findings.

Juan Ángel Martínez

View Profile

Juan Ángel Martínez

Monterrey, Mexico
Juan Angel - An educator, mentor, and data literacy advocate. Adjunct Professor at Tecnológico de Monterrey & EGADE Business School, empowering 500+ diverse bachelor's and master's students with essential data analysis skills. Commenced journey to involve wider audiences in data, nurturing careers across Mexico. Guided 30+ instructors nationwide in Tableau, fostering a data-driven ethos. Experienced Datathon judge, sought-after speaker on Business Intelligence, Data Storytelling, and Decision-Making. Committed to advancing global data skills. Excited to innovate as a Tableau Academic Ambassador.

Komes Chandavimol

View Profile

Komes Chandavimol

Bangkok, Thailand
Komes is one of the leaders in Data and AI in Thailand, committed to raising the country's understanding of these areas. By teaching in reputable business schools and speaking at public events, he shares important information to improve data literacy and encourage the use of AI. Since moving back to Bangkok, he has made a significant impact by using data to help businesses operate more efficiently, motivate young people to use data wisely, and show individuals how to use data in their everyday activities

Kunal Singh

View Profile

Kunal Singh

India
Hi, I am Kunal Singh and I am a final year student studying Computer Science and Engineering. I have always been fascinated by how technology can be used to solve problems and make the world a better place. This is what drew me to the field of engineering. In my free time, I enjoy reading books, hiking, and playing games like football and badminton. I am also a tech enthusiast and I love to explore new technologies. I am proficient in programming languages like C, C++, JAVA and Python. I have also experience in Machine Learning, Deep Learning, Artificial Intelligence and Natural Language Processing. I have also held important position of responsibilities in my college such as Management Head and General Secretary. I am always looking for new challenges and opportunities to learn and grow. I am excited to graduate and start my career in engineering. I am confident that my skills and passion will allow me to make a positive impact on the world.
 

Kushagra Rastogi

View Profile

Kushagra Rastogi

Dallas, United States of America
Currently, I hold the position of Data Analyst Intern at CBC, Dealer Safeguard & CreditDriver, powered by Informativ a fintech startup. My enthusiasm for data is unwavering, and I possess a solid foundation in the realms of Data Science and Analytics, driven by a profound passion for both data analysis and business intelligence. Simultaneously, I am pursuing a Master's degree in Business Analytics with a specialization in Data Science at the University of Texas at Dallas. This academic endeavor has equipped me with advanced skills in statistics, predictive analytics, database fundamentals, and data visualization techniques, with a particular focus on Tableau—an exceptionally potent tool for crafting compelling data narratives and visualizations. Previously, I served as an Application Data Analyst at Accenture, where I successfully implemented machine learning models that significantly enhanced application performance by a remarkable 30%. My responsibilities extended to the analysis of data sourced from diverse databases, which I accomplished using Python and SQL. I efficiently consolidated these findings into a centralized repository for further analysis, harnessing the power of Tableau and Excel. My adeptness with these tools resulted in a 15% reduction in support calls and chat times, automated audit processes for over 5500 properties through SQL, yielding a substantial 40% reduction in critical audit time. Moreover, I contributed real-time insights and trend analysis by creating reports and dashboards. In earlier roles, such as Senior Technical Support Analyst and Technical Support Associate, I honed my skills in data processing, user testing, and customer support. My overarching objective is to leverage my expertise in data science and business analytics to empower organizations to make informed, data-driven decisions that drive their performance and foster growth. I remain deeply committed to continuous learning, eagerly embracing novel tools and techniques, and fostering collaboration with cross-functional teams to deliver solutions that leave a lasting impact.

Leong Yi Yun

View Profile

Leong Yi Yun

Singapore
Hello! I am Yi Yun, a final year undergraduate at Singapore Management University. I am pursuing a Bachelor of Business Management with Operations Management and Marketing majors. As a self-directed learner, I actively look for opportunities to widen my knowledge and develop my skills by taking up organizing committee roles in my co-curricular activities. This also motivated me to learn more about Tableau and data storytelling through participating in Student Viz Challenges. I greatly enjoyed the challenges and the past year as a Tableau Academic Ambassador. Hope to be able to continue engaging a larger group of my peers to share about data visualization. Looking forward to connecting with you!

Lily Lim

View Profile

Lily Lim

Singapore, Singapore
Lily is an undergraduate at Yale-NUS College, majoring in Global Affairs and minoring in Environmental Studies. Her interests and background lie in Sustainability, Public Policy and Consulting. She developed a deep passion for data visualisation and its power to convey insights in a compelling manner ever since she co-founded her NGO, Youthtopia, in 2020. Furthermore, she enjoys utilising data-driven solutions to solve real-world problems and is fascinated by data visualisation tools such as Tableau, that enable complex data to be simplified and presented in a much more palatable manner. In her free time, Lily enjoys playing tennis and volunteering in her community.

Linh Mai

View Profile

Linh Mai

Singapore, Singapore
Hi! I am Linh (pronounced like Ling!), currently studying Economics and Data Science at Nanyang Technological University, Singapore. As a data enthusiast, I have always been curious about how data can say so much about the world around us. However, I often find that showcasing this data succinctly and intuitively to a general audience is always a challenge. Luckily, through my recent internship as a Business Intelligence Intern, I got the chance to get familiarised with Tableau, and I was in awe at the plethora of options Tableau provides to help users present their data and ideas in the most effective way possible. Becoming a Tableau Ambassador is, therefore, a great opportunity for me to spread my love for data and encourage more students to learn valuable data visualisation skills through Tableau.

Luka Perkovic

View Profile

Luka Perkovic

Memphis, Tennessee, United States of America
Luka Perkovic, a Memphis-based educator and entrepreneur, is the Founder of TopCourse and Co-founder of VistaData. He's revolutionizing STEM education through industry collaborations. VistaData, his tech consultancy, uses AI and data analytics to refine learning and teaching in the classroom. A McAfee School of Business MBA adjunct professor, Luka emphasizes hands-on learning through Tableau.

Mary Dunaway, Ph.D.

View Profile

Mary Dunaway, Ph.D.

Baltimore, United States of America
I am an Assistant Professor at Morgan State University's College of Business, specializing in Information Science and Systems. As a passionate Tableau warrior for data-driven innovation, I lead dynamic collaborations in my university's exhilarating field of Data Analytics. My instruction spans Management Information Systems, IT Strategy Project Management, and Data Analytics courses for undergraduate and graduate students. I earned a Ph.D. in Information Systems from the University of Arkansas-Fayetteville, specializing in Enterprise Technology systems. My research shines a light on critical topics like bias in Artificial Intelligence, combating Cyberbullying, addressing Problem Gambling in higher education, and understanding the intricate dynamics of technology teams in organizations. My journey as a research scholar has led to numerous premier publications in information systems journals, textbook chapters, media features, and conference presentations, all contributing to a brighter and more promising future in business and technology.

Melody Goodman

View Profile

Melody Goodman

New York, United States of America
Melody Goodman is the is the Vice Dean for Research, Professor of Biostatistics, and Director of the Center for Anti-racism, Social Justice & Public Health, at New York University School of Global Public Health. She has over 100 peer-reviewed journal articles and two books; Public Health Research Methods for Partnerships and Practice and Biostatistics for Clinical and Public Health Research. Dr. Goodman is a biostatistician and research methodologist. She is a Fellow of the American Statistical Association and 2021 recipient of the societal impact award from the Caucus for Women in Statistics.

Mike Daly

View Profile

Mike Daly

West Des Moines, United States of America
My name is Mike Daly. I have been in the role of informatics pharmacist at The Iowa Clinic and an Associate Professor of Pharmacy Practice at Drake University in Des Moines, IA, since 2017. Before that, I was a Clinical Pharmacy manager at an academic medical center in St. Louis, MO. I am originally from Omaha, NE, and earned a Bachelor of Science in Biology from Creighton University before earning a Doctor of Pharmacy from the University of Nebraska. While in St. Louis, I earned a Master of Science in Clinical Investigation from Washington University. I work with students from Drake University to help them learn and use informatics and data analytics skills to extract and analyze population-based data to improve medication outcomes and decrease costs. I am interested in growing my knowledge and skills with Tableau to improve my teaching and data visualization applications. When not working, I enjoy spending time with my wife and four children and playing pickle ball and tennis.

Mohamed Azfar

View Profile

Mohamed Azfar

Singapore, Singapore
Hi! I'm Azfar, a final-year student at Temasek Polytechnic studying Big Data & Analytics. I'm currently interning as a data analyst at Synapxe and have a deep passion for data analysis. I excel in using tools like Python, KNIME, PowerBI, and Tableau, constantly staying updated with the latest industry trends. My goal is to become a data scientist, providing valuable insights to decision-makers in various sectors. Outside of academics, I'm actively involved in volunteering and giving back to the community. To further hone my skills, I'm eager to pursue further studies at local universities. I'm proud to have been recognized as one of the top 10% academic achievers, on the prestigious IIT Director's List.

Moyu Matsunagi

View Profile

Moyu Matsunagi

Kanazawa, Japan
北陸大学経済経営学部マネジメント学科3年生の馬緤百優です。 私は新しいことに挑戦することが好きで、いつくかのコンテストやDATA Saber認定プログラムに挑戦しています。 コンテストでは、「Tableau分析コンペティション」最優秀賞と、「Tableau企業分析AWARD2022」3位と、「Rising未来のデータサイエンスコンテスト」アイデア部門準優勝をいただいた経験があります。

Nathalie Richer

View Profile

Nathalie Richer

Zurich, Switzerland
Hi, my name is Nathalie, I am a French data visualization creator freelance based in Zurich. I fall in love with Tableau and then became active on Tableau Public in 2018 by participating to Tableau community projects like WOW, RWFD. In 2020, I became a Tableau Featured Author and as a participant to the #IronViz challenge, I landed in the top entries for the 2022 and 2023 edition. I love data driven storytelling and discovering insights. With an academic background in Science, I have always love teaching, so I enjoy sharing my passion for Tableau and Data Visualization during professional training and teaching. Since 2019, I have been teaching Tableau at Paris School of Business to MBA and Master students.

Neha Jaladi

View Profile

Neha Jaladi

Richardson, United States of America
I'm Neha Jaladi, currently serving as a Graduate Teaching Assistant at UTD, majoring in Information Technology and Management. With 2 years at Accenture as a Software Engineer, I've honed my data analytics and software development skills. Specializing in data analytics and science, I'm dedicated in empowering the next generation of tech leaders.

Nissato Genta

View Profile

Nissato Genta

Tokyo, Japan
I first encountered tableau in college. I was shocked at how beautifully it visualized data, and I have been captivated by tableau ever since. I was selected as a finalist for a lecture on data analysis using tableau based on actual corporate data, and gave a presentation directly to the company. Since then, I have been involved in lectures on tableau for junior students and supporting lectures on tableau to spread the use of tableau.

Patrick Müller

View Profile

Patrick Müller

Stuttgart, Germany
Patrick Müller has a degree in business informatics and has worked as a forensic data analyst in consulting and as a data scientist in industry. Since 2020 he has been self-employed with a consulting focus on the preparation and implementation of data analysis projects. He is a lecturer in the certificate courses "Certified Fraud Manager" and "Certified Audit Data Scientist" at the Frankfurt School. One of his teaching focuses is visual analytics. His professional passion is "Turn Fraud into value and Insights into EBIT".

Professor Amir Michael

View Profile

Professor Amir Michael

Durham, United Kingdom
Professor Amir Michael is a Professor of Accounting and Head of Accounting Department at Durham University Business School, Durham University, UK whose research and teaching interests have been fostered by several years of undergraduate and postgraduate teaching and mentoring. Amir was the former Associate Dean for MBA/DBA and the Director of the Durham MBA (Full Time) programme. Professor Michael is the director of the Durham Rutgers Accounting Analytics Network (DRAAN). His resrearch interest and expertise is in the area of auditing and reporting using data analytics and artificial intelligence in improving audit and reporting quality and transperancy. He is also interested in accounting education digital and technology adoption research. Amir has been instrumental in the development the BSc in Accounting (KPMG/ICAEW) School Leavers Programme. This innovative programme has been mentioned in the House of Commons and cited in the government education White paper as an example of good practice in higher education and the highly influential Wilson “Review of Business–University Collaboration” report to Government. Amir’s teaching philosophy reflects his interests in collaborative authorship, preferring student-centred teaching that encourages learning by students and teachers rather than traditional teaching. Amir is interested in sharing his research with students which facilitates applying the research-led-education approach that is a cornerstone of Durham University.

Rachel Wang

View Profile

Rachel Wang

Oxford, United Kingdom
Rachel Wang is a Senior Lecturer at Oxford Brookes Business School, Oxford Brookes University. Rachel specializes in Business Analytics and has worked on and taught Business Analytics Modules for over 5 years. Rachel’s research interests are primarily in data analytics and the application of big data in business studies. The more focused research topics are: • The application of data analytics and big data in a wide range of business functions, such as marketing, human resources, finances and customer satisfaction • Date generation, data usage and governance of data in SMEs in the emerging data economy • The impact of digitalization on tourism identity • Financial implication on hospitality and tourism policy development Rachel recently won a Knowledge Transfer Partnerships (KTP) project funded by Innovate UK (http://ktp.innovateuk.org/), to investigate and design analytical dashboards for retail businesses. Before completing her doctorate and joining higher education, Rachel worked as a Senior Data Analyst at an FTSE 100 company for six years. Rachel worked in different sectors in China, Singapore and the UK in the past. In her free time, Rachel enjoys travelling, reading and writing.
 

Reina Uchinokura

View Profile

Reina Uchinokura

Kasuya district, Japan
I'm Reina. I live in Fukuoka, Japan. I am studying business management at Fukuoka University. In the future, I would like to do product development and planning. I am using Tableau in my seminar activities. I passed the certification exam called DATA Saver. I am studying so that my disciples can pass the exam. My hobbies are watching YouTube and exercising. I played volleyball for 6 years. I am doing taekwondo now. I will study Tableau more and do my best to create an environment where students can easily use Tableau.

Rex Moody

View Profile

Rex Moody

San Angelo, TX, United States of America
Rex Moody is an Associate Professor of Marketing and Chair of the Department of Management and Marketing at Angelo State University in San Angelo, Texas. He teaches classes in marketing and data analytics, specializing in marketing management, promotion management and data visualization. Rex first used Tableau in his data visualization course in 2016 and finds that most students enjoy visualizing data as opposed to using only statistics to analyze data. Rex served on the Tableau Instructor Advisory Council and enjoys attending the Tableau Conference to meet other educators and professionals in the Tableau Community. He earned his Ph.D. in marketing at the University of Colorado-Boulder and has an MBA from the University of New Mexico. He worked in the advertising and public relations field for several years after earning his BA from Colorado State University. Rex’s research falls mostly in the marketing pedagogy area, but he has also completed research in golf course design and pricing. In 2022 Rex was named Marketing Educator of the Year by the Marketing Educators’ Association (MEA). He serves as co-secretary/treasurer for the MEA and as treasurer for the Concho Valley Beekeepers Association. When not working, Rex enjoys building Lego, quilting, and taking care of their many animals with his wife.

Rohit Prasad

View Profile

Rohit Prasad

Chemnitz, Germany
Thank you for visiting my profile. My academic background is blended with Bachelor's and Master's degrees in the Business and Technology domain. Currently, I reside in Germany. I am a dynamic and passionate data enthusiast, proudly serving as the Tableau Academic Ambassador for the last 2 years. With an insatiable curiosity for data analytics and visualization, I have emerged as a leading advocate for the power of Tableau in transforming complex data into meaningful insights. Born with an innate aptitude for data-driven decision-making, I embarked on a journey of exploration and learning in the data analytics domain during my academic pursuits. Armed with good academic and professional experiences in the field of multiple domains, I swiftly recognized the immense potential of Tableau in simplifying the intricate art of data visualization. As a Tableau Academic Ambassador, I am dedicated to fostering a culture of data literacy within our academic community. I am a fervent advocate for integrating Tableau into educational curricula, enabling students to develop crucial skills that will drive innovation and informed decision-making in various fields. Throughout my tenure as an Ambassador, I am committed to organizing workshops, webinars, and training sessions to empower students and educators alike with the ability to harness the full potential of Tableau. I believe that knowledge is most valuable when shared, and I am always eager to collaborate with peers and institutions to push the boundaries of what data can achieve. My vision extends beyond the classroom, as they actively engage in projects and research endeavors that utilize Tableau to tackle real-world challenges. I firmly believe that data has the power to address pressing global issues, and I am determined to be at the forefront of this transformative journey. I join on this mission to unlock the true potential of data visualization and analytics through Tableau. Together, we are lighting the way for a brighter, data-driven future in the academic sphere and beyond.

Ronnie Das, PhD

View Profile

Ronnie Das, PhD

Nantes, France
Ronnie Das is an Associate Professor of Digital and Data Driven Marketing at Audencia Business School, France. He is also Head of the Marketing Department. Prior to joining Audenica, Ronnie has spent over a decade in UK higher education researching emerging technologies and application of data and machine learning in understanding marketing 4.0 and transformative consumer behaviour. Ronnie's research, with Newcastle University Urban Observatory, on Big Data driven insight into citizen behaviour during COVID crisis was published by the World Economic Forum and London School of Economics Impact Blog. Ronnie has also chaired prestigious research workstreams and research hub (SuperGen Energy Network) committees funded by the UKRI (EPSRC). He has also successfully developed and delivered projects funded and supported by ING Economics. Ronnie has further own applied innovations challenges organized by the European Commission including EU Datathon 2020 and European Innovation Sprint 2020. He was also invited to talk at the European Central Bank.

Russ Cantrell

View Profile

Russ Cantrell

Mobile, United States of America
Russ Cantrell is a PhD candidate and the Director of Data Administration and Strategic Initiatives at the University of South Alabama. As both faculty/staff as well as a dual-major student, Russ is working to unite various facets of the University by encouraging, implementing, and supporting Tableau at the Colleges of Medicine, Business, Computing, and their academic medical center at USA Health. Russ is also one of the parties starting a Central Gulf Coast TUG which will begin meeting this Fall. His research interests are predictive analytics, data science, information security, and burnout.

Ryoka Izawa

View Profile

Ryoka Izawa

Yokohama, Japan
"I love to passionately share what I believe valuable.” As a student I actively participate in the Tableau community for professionals. Tableau community has transformed the perception of working adults. I've had the opportunity to present to high school 250 students, imparting what I've learned from Tableau. Also, I have taken on the role of a hands-on instructor. Recently I have also initiated “A Student Company Analysis Award“ I recruited members to run it. I am deeply impressed by the beauty of 'community' that can be experienced through a single service!" I'll send this message out more.

Sam Li

View Profile

Sam Li

Washington, D.C., United States of America
Sam Li is a senior at Georgetown University studying Business and Global Affairs. As a passionate changemaker, he is excited to join the Tableau Community as an Academic Ambassador so that he can continue visualizing our world in new ways and learn with others every step of the way. Sam is also a content creator with his own YouTube channel ("Sam H Li") and podcast ("College Conscience") where he discusses everything from personal growth to professional development. He always enjoys a good cup of coffee whether that's from his French Press at home or a local coffee shop in D.C.

Sarthak Mehta

View Profile

Sarthak Mehta

London, United Kingdom
I'm Sarthak Mehta, a student at Queen Mary University of London pursuing Marketing & Digital Analytics. I'm a founder of digital marketing agency, and I hold over three years of work experience in the industry.

Shashanka S. Ranade

View Profile

Shashanka S. Ranade

Dallas, Texas, United States of America
I'm Shashanka S. Ranade, nearing the completion of an MBA and a Master's in Information Technology and Management with specializations in Business Intelligence and Analytics at The University of Texas, Dallas -UTD (May 2024). I hold Graduate Certificates in Applied Machine Learning and Business Intelligence and Data Mining (Dec 2022), fortifying my AI, ML, DL, NLP, Data Science and Analytics expertise. I am AWS Cloud Practitioner certified. Beyond academia, I'm a Microsoft Ambassador and President of SALSS (The Student Association of Lean and Six Sigma) at UTD. Boasting over a decade of professional experience, my most recent role at Wabtec Corporation, a global Rail Technology leader, saw me spearheading AI/ML Data science and Analytics projects. I aspire to excel in Full-Time roles such as Director, Senior Manager, Senior Technical Product Manager, or Senior Product Manager, leveraging my deep technical knowledge, leadership understanding, and a proven track record of driving innovation.

Sheng Lu

View Profile

Sheng Lu

United States of America
I am an associate professor in the department of fashion and apparel studies at the University of Delaware. I regularly teach data-intensive courses, such as retail math, fashion companies’ pricing strategies, and global apparel sourcing. As a Tableau Academic Ambassador, I am excited about the opportunity to integrate this tool into our fashion curriculum, equipping our students with essential data analysis skills crucial for success in the increasingly data-driven fashion industry.

Shintaro Tajiri

View Profile

Shintaro Tajiri

Kanazawa, Japan
A professor at Hokuriku University, I coordinate the Data Science & AI Education Program and serve as the Vice Dean for Information & Institutional Research. In 2022, I launched a mandatory course for all freshmen, teaching data analysis using Tableau. Students from this program have won external contests, and our program was recognized by Japan's Ministry of Education as a pioneering program with unique innovations. I excel in creating learning platforms. I enjoy exploring Hokuriku's exquisite restaurants in my free time.

Shumin Lin

View Profile

Shumin Lin

Los Angeles, California, United States of America
My journey into data analytics began in banking, where I managed digital lending and financial modeling. Transforming business intelligence fueled my switch to tech, leading me to pursue an MBA at UCLA Anderson focused on business analytics. I find fulfillment in wrangling and visualizing data for real impact, which deepened my fascination with Tableau's data empowerment. As I aspire to learn and become a data scientist, I value the power of collaborative learning. I'm excited to be a Student Ambassador bridging UCLA and Tableau, fostering an energetic community in this data-driven era!

Taiwo Adegite

View Profile

Taiwo Adegite

Lagos, Nigeria
Taiwo is a senior undergraduate at the Federal University of Technology, Akure, majors in Statistics. His fascination with Tableau ignited during a Data Analytics course, introducing him to data visualization with Tableau. He's drawn to crafting interactive data visualizations, aiming to demystify complex data for non-tech individuals. Sharing knowledge brings Taiwo immense joy. He wholeheartedly supports eager learners, nurturing their curiosity. And as a two-time Tableau Ambassador (2022 & 2023), he views this role as the realization of a long-standing dream. Feel free to connect with him.

Tiffany Spencer

View Profile

Tiffany Spencer

Atlanta, United States of America
Tiffany Spencer is a 7x certified Salesforce professional and Salesforce MVP with over 15 years of experience leading digital transformations for small to large corporations utilizing the Salesforce platform. She is the founder and CEO of Tech Forward Solutions, a Salesforce Consulting Partner that focuses on training, technology, and talent. She’s also the founder and CEO of Tech Forward, a nonprofit organization that exposes marginalized communities to cloud and SaaS-based technologies and career paths to help participants become more marketable, obtain higher-paying jobs and career opportunities through three programs: HBCU Forward, Community Forward, and Forward into Tech. In 2022, the Salesforce consulting firm Tiffany co-founded was acquired. Also, in 2022, Tiffany spearheaded a new community conference, Dreamin’ In Color, which convened over 250 participants and sponsors seeking to increase opportunities for current and aspiring Black Salesforce professionals.

Valerie Black

View Profile

Valerie Black

Belize City, Belize
Valerie Black is currently pursuing a MSc Business Analytics with Risk Management and Financial Engineering from the University of the West Indies, Cave Hill, Barbados. She previously earned her BSc Business Administration in Finance (Hons) from the University of Belize. She was first introduced to Tableau during her Data Preparation and Visualization course and was taken with how easily one could relay their data story and the simplicity of creating interactive charts and dashboards in an effective and efficient manner. Valerie aims to utilize her passion for data visualization in risk management to assist organizations in identifying, addressing, and mitigating threats, thereby contributing positively to their growth, adaptability, and client service. Additionally, she is the current Vice President of Partnerships for the Cave Hill Association of Post Graduate Students and aspires to use this role to introduce more individuals to the advantages and applications of Tableau. She also looks forward to interacting with fellow Tableau enthusiasts and assisting those interested in building or honing their data analysis, data visualization and storytelling skills. In her spare time, she enjoys running, coloring and rock climbing.

Woody Wu

View Profile

Woody Wu

Toronto, Canada
Hello Tableau Community! I am a recent graduate from the University of Toronto, where I earned an Honours Bachelor of Arts in Economics and Applied Statistics. Currently, I am managing the Finance and Data Lab at the University of Toronto Scarborough, where I continue to share my passion for finance and data with students. Previously, I have worked in equity research and mergers and acquisitions (M&A), where I leveraged the power of Tableau to provide actionable insights for clients. I am a strong believer in continuous professional development and I am currently pursuing the Chartered Financial Analyst (CFA) and Financial Risk Manager (FRM) designations. I am humbled and honoured to be selected as a Tableau Academic Ambassador and I look forward to continuing my Tableau journey with my fellow Tableau Ambassadors. In my free time, I love cooking, travelling, and playing sports.

Yosue Canaviri

View Profile

Yosue Canaviri

New York, United States of America
I am a dedicated and highly motivated professional with a strong foundation in data science and a passion for translating complex data into actionable insights. My educational background includes a Master of Science in Applied Analytics from Columbia University and a Bachelor of Arts in Economics from the University of Minnesota. With a proven track record of delivering valuable contributions in both academic and professional settings, I am committed to driving data-driven decision-making and innovation.

Yuming Hu

View Profile

Yuming Hu

madrid, Spain
Graduated with a bachelor of science of Cum Laude in Economics and Management of Information at Maastricht University. During the undergraduate, Yuming found it inspiring to his analytical skills to solve business problems. He was selected for "Mable Excellence Programme" for the academic excellence. He also completed "Tableau Desktop Specialist" and "Google Advanced Data Analytics". Currently, Yuming was pursuing a Masters in Management at IESE Business School with a keen to enhance his both technical and business skills.

DataDev Ambassadors

DataDevs are community-driven and passionate about leveraging Tableau's APIs to extend, embed, or customize Tableau. They are curious, innovative, and love to build— always tinkering with new tools and applying them to fresh ideas.


Alex D'Ambra

View Profile

Alex D'Ambra

Sydney, Australia
Introducing Alex, the Senior Manager of Product Analytics at SafetyCulture, a thriving Australian tech company headquartered in Sydney. With a wealth of experience spanning over 15 years, Alex has navigated the intricacies of data and analytics across various industries and organizations of varying sizes. Alex's genuine passion lies in making data accessible to as many people as possible. He's a dedicated Tableau aficionado, harnessing its versatile features to simplify the data journey for all. In a world where data is invaluable, Alex is your trusted guide, ensuring its benefits reach far and wide.

Anya Prosvetova

View Profile

Anya Prosvetova

Amsterdam, Netherlands
Anya is a data engineer with a background in SaaS, consulting, financial services and the creative industries. She helps organisations converting data into value, developing data strategies, and automating processes. She is also interested in building custom Tableau-based applications using Python and JavaScript. A believer in sharing knowledge, Anya helps people to develop their data skills by introducing data analysis and visualisation tools into their everyday workflows, conducting trainings, writing manuals, articles, and presenting at events. She is also one of the organisers of Data + Women Netherlands community.

Brian Crant

View Profile

Brian Crant

Phoenix, Arizona, United States of America
Brian Crant is a Senior Data Engineer at Astra, where he is building out systems and tooling to execute on Astra's mission of "Improving Life on Earth from Space". During the first few years of his career, while working at software startups in San Francisco, CA, he found his calling in the data and business intelligence space, and has been a proud member of the Tableau DataDev community ever since. He is passionate about building tools and information systems that save time and enable others to do their jobs well. Outside of work he enjoys live music, woodworking, and building guitar pedals.

Cristian Saavedra Desmoineaux

View Profile

Cristian Saavedra Desmoineaux

Lithia, United States of America
I am a Developer Advocate, or as Warren Thornthwaite used to call me, a Data magician with many hats that every day pushes the limits to improve and help make faster and better decisions. My passion as a System Engineer is helping to grow others, bringing my experience of over 20+ years in designing & implementing Data Warehouses and leading Data & Analytics mission-critical projects for Telco, Energy, Mobile Food, and Health Care. I enjoy playing LEGO and sharing knowledge as an author for TowardsDataScience.com at https://cristiansaavedra.medium.com/ You can find me on LinkedIn or in our Latin community comunidatos.com

Dan Bolinson

View Profile

Dan Bolinson

Madison, United States of America
Dan Bolinson is a Senior Manager with Baker Tilly, where he specializes in helping his clients solve their toughest business problems, leveraging technology. He’s an avid user of Tableau, and is passionate about how Python and Tableau can be used together. Given half an opportunity, he’ll talk your ear off about how great combining these two tools can be. He is one of the maintainers of the Trex Jacket, an open-source project that makes it easier to build Tableau Extensions using just Python and leveraging Anvil X. When he’s not pushing the limits of how people use Tableau Dashboards, he’s playing with his two daughters, his two cats, or his four chickens, and he occasionally tries to build things out of wood.

David Nguyen

View Profile

David Nguyen

Sydney, Australia
David Nguyen is a technology professional with 13+ years of experience in software development and data analytics across finance, reinsurance, and investment sectors. David has a great passion in using technology and data analytics to help organizations identify new opportunities, mitigate risks and leverage insights to make better strategic business decisions. He has been using Tableau since 2015 and has been recognized as a Tableau expert within his organization. He is the owner of https://VisualAnalytics.Pro and https://123Analytics.Academy in which he shares tips, tricks, and best practices on how to leverage the power of Tableau to accelerate your business insights and drive growth. He currently lives in Sydney and his hobbies include road trips, aerial photography, and virtual reality.

Elliott Stam

View Profile

Elliott Stam

Amsterdam, Netherlands
Having over nine years of hands-on experience with Tableau, Elliott is one of the original DataDev ambassadors. He creates tutorial content using YouTube videos and written articles to share tips, tricks, and step by step guides on topics such as the Tableau REST API and other data-driven interests. With career experience in data engineering, analytics, and consulting, he currently lives in Amsterdam working in the payments industry as a data scientist. Personal projects focus on applied machine learning and reinforcement learning. In the winter he might be spotted falling down a mountain with a snowboard strapped to his feet.

Jordan Woods

View Profile

Jordan Woods

Dallas, Texas, United States of America
Jordan has been working in data for about 10 years, and has a passion for using data and Python to solve problems. He is a Tableau certified data analyst, and regular contributor to the tableauserverclient, and can be found on the Tableau DataDev slack channel, where he answers questions about the various Tableau APIs.

Kerem Kargin

View Profile

Kerem Kargin

Istanbul, Turkey
Kerem is passionate about data visualization and analytics and has dedicated his career to empowering individuals and organizations to harness the power of data to make informed decisions. As a Senior Data Visualization Engineer at a well-known consulting firm, his journey has been marked by fostering a data-driven culture and providing comprehensive analytical frameworks. One of the cornerstones of his philosophy is the belief that knowledge grows when it is shared. In line with this principle, he has made it his mission to nurture emerging talent in the field of data visualization. Through workshops, seminars and mentoring initiatives, he try to pass on his insights and experience to the next generation of enthusiasts. Kerem also produces content on social media platforms for those who want to improve themselves in the IT sector and data. You can check his social media accounts from the links below!

Kyle Massey

View Profile

Kyle Massey

Columbus, OH, United States of America
Kyle is a 2x Tableau DataDev Ambassador who lives with his partner, Dan, in Columbus, OH. He is a Lead Software Engineer managing the central development and automation team for Business Intelligence tools at JPMorgan Chase. Kyle co-leads the Tableau Coders Initiative TUG, helping users go from zero-to-hero with Tableau's APIs and other dev tools. He is originally from Cincinnati, OH but moved to Columbus in 2004 to attend the Ohio State University and never left! In his spare time, Kyle enjoys playing video games, spending time with his pets – Kevin (dog) & Willie (cat).

Marcelo Has

View Profile

Marcelo Has

São Paulo, Brazil
Marcelo Has is a data lover and passionate about helping people with their careers. He has extensive experience in various areas such as Data Product, Dashboard Design, Data Engineering, Data Visualization, Storytelling, and Coding. He is 2x #VizOftheDay, and 5x Tableau Certified (Including Customer Success). Marcelo is the creator of the Tableauzando YouTube channel, where he publishes free content on Tableau and Design within Tableau. He also built the Tableau Data Dictionary Generator, a free tool where you can use your .twb or .twbx file to generate a data dictionary in seconds.

Mike Komer

View Profile

Mike Komer

Overland Park, Kansas, United States of America
Mike is a Big Data Expert and experienced data wrangler. Being a data wrangler means Mike is highly skilled at pulling raw data from different sources, transforming it into a usable format to then utilize the data the best way possible. Currently working on the Enterprise Applications and Data Governance team at Wagner Logistics, Mike is focused on Tableau Development and Data Modeling. There he helps build and maintain the end to end data pipeline for Tableau Apps and develops Enterprise Dashboards for the organization. Mike is incredibly proud and excited to be a part of the DataDev Ambassadors, engage with the community, and push the limits and capabilities of the Tableau Apps.

Nik Dutra

View Profile

Nik Dutra

São Paulo, Brazil
Nik Dutra is a Data Lead with eight years of experience empowering companies to make the best decisions with data. Nik specializes in Data Storytelling and started his journey with Tableau Software during his internship, focusing on best practices in data visualization, leveraging the power of data architecture, and ensuring data governance. Nik is a powerful force with his out-of-the-box thinking and strong leadership. In his free time, Nik enjoys attending Rock 'n' Roll concerts, riding motorcycles, and studying coffee preparation.

Sean Lin

View Profile

Sean Lin

Nashville, United States of America
Sean currently serves as a Data Analyst at Amazon, utilizing Tableau and Data Analytics solutions to enhance customer purchasing experiences. He is passionate about delivering solutions for both internal and external Tableau users, aiming to expedite tasks by establishing efficient and transparent automations. With over 3 years of experience in utilizing Tableau, Sean is proficient in deploying and applying Tableau Server, Tableau Prep, and Tableau Desktop to solve technical challenges. He also possesses proficiency in AWS and Azure Data Analytics Solutions, which contribute to building a solid foundation for Tableau Enterprise Usage. And now, he employs Tableau to monitor metrics that significantly impact customer service experiences at Amazon.

Timothy Vermeiren

View Profile

Timothy Vermeiren

Mechelen, Belgium
Timothy is a passionate analytics specialist from Belgium with a comprehensive knowledge of Tableau and related topics such as automation and embedding. At Biztory, he acts as an Analytics Domain Lead while also developing "cool stuff" to extend platforms like Tableau. His hobbies include running, playing the guitar or drums (poorly), listening to metal music or simply enjoying a beer with his friends. Last but not least, he made it to 2018 Global Iron Viz Champion! His biggest ambition of the decade, successfully tackled. Now, in 2023, he is honored to serve a fourth term as a Tableau DataDev Ambassador.

Tristan Guillevin

View Profile

Tristan Guillevin

Rotterdam, Netherlands
Tristan, founder and director of a data visualization studio based in the Netherlands, is a Tableau Visionary, Ambassador, and 2017 Iron Viz Champion. Passionate about bending the limitations of existing tools, he has crafted specialized products like Advviz, which allows for the creation of advanced visualizations in Tableau with a single click, and BANg, a tool designed to simplify the process of building KPI dashboards. To democratize data visualization expertise, Tristan consistently shares insights through educational content on YouTube and a subscriber-based newsletter. All of this contributes to his overarching goal of maintaining a location-independent business operation.

Vorapol Santhadkolkarn

View Profile

Vorapol Santhadkolkarn

Bangkok, Thailand
Vorapol is a Solutions Architect Director at a consulting firm based in Thailand with nearly 10 years of experience in Tableau and 16 years in the Data Analytics field. He is skilled in designing complex Tableau Server deployments and using Tableau's Developer APIs to solve advanced challenges. His areas of expertise include Tableau Connected Apps, Hyper API, and automation with multiple Tableau APIs. Experienced in AWS, Azure, and Databricks, he can create a strong data platform foundation for enterprise-level Tableau use. Currently, he holds certifications as a Tableau Architect and Consultant. As a co-leader of the Tableau Thailand User Group, he helps with knowledge sharing, skill development, and building community. Vorapol is also a winner of the Tableau Thailand Viz Game 2018. Recently, he has taken an interest in Salesforce Integration with Tableau and AI Based Application.

Zak Geis

View Profile

Zak Geis

Springfield, United States of America
Zak Geis is an Executive Director in charge of global Business Intelligence Technology at JPMorgan Chase. An experienced leader in data analytics and visualization with a focus on enabling insight through best practices, Zak brings his love of Tableau and all things data to his role at the firm. Within his role, Zak leads several teams of experts who share a goal of using their talents and experience in BI to build on and learn from the power of data. Zak is also a 2x Tableau Visionary, Columbus TUG leader and member/leader of several other data-focused initiatives. You can find more on Twitter, LinkedIn & his website, datatheories.com.

CRM Analytics Ambassadors

CRM Analytics Ambassadors are power users of the native analytics and AI solution for Salesforce. They love to share their expertise in this specialized platform, and provide a bridge between the Salesforce Trailblazer community and the Tableau community.


Abhinav Garg

View Profile

Abhinav Garg

Ghaziabad, India
Salesforce CRM Analytics Architect - Delivering Insights That Matter. Having significant amount of experience in the field of IT, specifically in CRM Analytics. With 11 years of overall experience and 7.5 years dedicated to CRM Analytics, along with over 14 completed projects. Transforming Data into Insights and Action, Providing valuable insights to stakeholders and helping them make informed decisions.

Ada Xu

View Profile

Ada Xu

Toronto, Canada
Ada works as a manager at Sun Life in Toronto, Canada. Her primary focus is leading the transition of data, reporting, and insights into CRMA. Back when it was called Einstein Analytics, she stumbled upon this field when there was limited information available online. Over time, she've become an active member of the growing CRMA community, where she've had the privilege of helping others and witnessing the community's impressive development. It's been a fulfilling journey, and she is grateful for the opportunities it has provided.

Anith Viswambharan

View Profile

Anith Viswambharan

Atlanta, United States of America
Anith has worked on Salesforce technology for more than 10+ years and started his career as a Salesforce Business Analyst, administrator, Reporting SME, Scrum Master, proxy product owner, sales cloud consultant, and architect. Based in USA, Anith holds more than 17 Salesforce certifications, from Administrator, Developer, Consultant, Designer, and CRM Analytics and is an all-star ranger. In his spare time, he enjoys experimenting new concepts and techniques in playgrounds. Anith has helped with conducting POCs on a lot of beta functionalities in salesforce CRMA and has implemented some amazing optimization and best practices in this field. Anith is selected as CRMA Ambassador as well as Einstein Analytics champion. Anith is now an MVP for salesforce and an ambassador champion for CRMA Analytics.

Asmita Mohanta

View Profile

Asmita Mohanta

Dallas, United States of America
Asmita is a Data enthusiast and works primarily in Salesforce Data Cloud, CRM Analytics and Tableau. Currently, she works at SpringML as a Salesforce Analytics Consultant. She completed her Master of Science in Business Analytics at the University of Texas at Dallas (UTD). She has been working in the Salesforce ecosystem for the past six years and has earned several Salesforce and Tableau certifications. She specializes in Revenue Intelligence, Sales Analytics, Customer 360 and Net Zero Cloud. She aspires to explore Einstein GPT and Data Cloud and help customers solve their data challenges. Asmita is a former Tableau Academic Ambassador (2022-2023) and has conducted numerous Tableau events, bootcamps and competitions and trained 300+ students at UTD. She is a fitness athlete and a plant mom. She loves to paint, DIY projects.

David Masri

View Profile

David Masri

Brooklyn, NY, United States of America
David Masri founded Gluon Digital in 2020 with the goal of promoting data migration and integration best practices to the Salesforce Ohana. Prior to founding Gluon Digital (https://gluon.digital), Dave has spent years working with data and with Salesforce. He has been involved in dozens of Salesforce data migration and integration projects and has used that experience to run numerous training programs for aspiring integration/migration specialists, and then ultimately authored his book (Developing Data Migrations and Integrations with Salesforce) on the subject. Previously Dave was the Director of Professional Services at Plative, a Salesforce Gold Partner. Before that he was the Technical Director of Data Strategy and Architecture for Capgemini Invent's Salesforce Practice. He has more than 20 years of hands-on experience building integrated ERP, BI, e-commerce, and CRM systems, and for the past seven years has worked exclusively with the Salesforce platform. Dave holds more than ten professional certifications, including nine Salesforce certifications, the PMP (Project Management Professional), and Google’s Data Engineer Certification.

Gian Nass

View Profile

Gian Nass

Montijo, Portugal
Gian has a dream that is: to share to the world that technology is here and available for anyone. In order to do that Events, meetups, study groups, and evangelizing people is just some of the contributions this dream allows me to do. Gian is not from the IT world, and has made a pivot in his life/career 4 years ago when he found through technology his passion in supporting people. Having lead the meetup Florida Data tribe Gian helped over 10 people to get certified in Einstein, and gathered a group over 800 people, sharing about DATA, Analytics, ETL, and much more. The most interesting part for me is around the KNOWLEDGE universe where I strongly believe that: the more you share knowledge, the more you have it.

Harshala Shewale

View Profile

Harshala Shewale

London, United Kingdom
Harshala Shewale is working as Salesforce Business Architect in Accenture UK with 13 years of experience. She has been working with various industry verticals and has specialization in field service and data analytics.

Ines Garcia

View Profile

Ines Garcia

Woodborough, United Kingdom
I'm Ines Garcia. An Author, Agile & Climate Coach, Circular Economy professional (Cambridge) and Biomimicry Practitioner. I also implement carbon accounting software + all things Salesforce. I help organisations to deliver better value, to reduce waste: of time, effort, materials and energy. To focus on impact. To leave the place better than how we found it that’s: Product, People and Planet. If you are curious about growing your own food Im also a permaculture mentor!

Jennifer Shier

View Profile

Jennifer Shier

Bentonville, AR, United States of America
Jen is a Principle IT Admin on her 5th year at Palo Alto Networks. Currently, her passion drives her to be a bridge between departments for all Salesforce analytics products including CRM Analytics, Tableau, Data Cloud, Native Salesforce analytics, and Event Log Monitoring. Her background includes Salesforce architecture and analytics since 2001, Dreamforce speaker 2003-2019, and 4x MVP. As a single parent, her free time is spent with her 13yr old son and quartz crystal mining.

Kishan S

View Profile

Kishan S

Chintamani ,Karnataka, India
I am an experienced Salesforce CRM Analytics Developer with over two years of expertise in successfully managing multiple end-to-end projects. I specialize in crafting insightful solutions that bridge the gap between raw data and actionable insights. In my leisure time, I engage in blogging about the CRM Analytics use cases and challenges I encounter in my professional work experience.

Kristi Brown

View Profile

Kristi Brown

Yuma, United States of America
Salesforce Architect and MVP with 10+ years of experience. Versatile, accomplished professional with experience across the Salesforce Ecosystem including but not limited to: Sales Cloud, Service Cloud, Salesforce CPQ, CRM Analytics, Experience Cloud (Communities), Salesforce Anywhere/Quip, and Slack. I'm fluent in Flow, SOQL, SAQL, SOSL, DML, and am getting my bearings with Apex. I've worn many hats over the years like Business Analyst, Project Manager, Admin, Admineloper, Architect, Manager, and Consultant and bring each of those hats with me to tackle new challenges and projects.

Kyle Cruickshanks

View Profile

Kyle Cruickshanks

Halifax, Canada
Kyle is the Business Intelligence (BI) Practice Lead at CloudKettle. He has 6+ years of experience leading teams that help clients better leverage data to improve business processes and decision making. He holds multiple Salesforce certifications and has spoken at Dreamforce on CRM Analytics. Kyle holds a passion for helping others grow and succeed in their professional journeys. He is a member of the Trailblazer mentorship program and a longstanding member in the Ten Thousand Coffees program. Kyle is ready to help inspire others and promote data driven decision making as a Tableau Ambassador.

Lauren Mills

View Profile

Lauren Mills

Houston, United States of America
I'm Lauren Mills and have been working in the Salesforce ecosystem for 10+ years across many different clouds and industries. I have a passion for providing solutions across the platform that enable my stakeholders to be successful within the technical landscape I support. Currently I am responsible for the enterprise rollout of CRM Analytics across Travelers. I have been working on the CRMA platform since 2017 and was part of the inaugural Einstein Analytics Champions which has since evolved to CRM Analytics Ambassadors. Additionally for the past 10 years I have been a co-leader of the Houston Salesforce Developer/Architect group. When not talking Salesforce I enjoy staying active and outdoors.

Laurie Rugemer

View Profile

Laurie Rugemer

Bozeman, MT, United States of America
As a data scientist and data viz expert, Laurie is passionate about surfacing analytics and predictive modeling insights to help businesses drive action and improve outcomes. With master's degrees in science education and statistics, her extensive background in statistical consulting and teaching have helped her better serve her clients. As a speaker at Tableau Conference 2021, Dreamforce 2023, and the leader of the global Tableau Community at Slalom, Laurie is dedicated to showcasing the advantages of an integrated analytics and AI experience through Salesforce and Tableau.

Manny Omideyi

View Profile

Manny Omideyi

London, United Kingdom
I have two full-time jobs as a husband and dad, and (while my demanding bosses are out living their lives) a part-time one as an independent consultant and Salesforce partner modelling and visualising data to help my clients make informed decisions. None of it ever feels like work though, because I genuinely do what I love and love what I do. Feel free to get in touch for consulting opportunities, technical assistance, mentorship, or if you have content you'd like to share at London Datatribe (see Youtube link) meetups

Mohammad Eusuf Daud

View Profile

Mohammad Eusuf Daud

Mogliano Veneto, Italy
Successful leader with 22+ years of experience in driving innovative process improvements Eusuf is a passionate Salesforce Application architect & Tableau CRM Analytics Ambassador since 2020, enjoying the time with Financial Services Cloud,Data Cloud and Salesforce CRM Analytics. Experiencing the evolution of Salesforce ecosystem since 2007, helped colleagues to play with Salesforce efficiently and ensured business value to the customers in 4 continents. A great enthusiast of Artificial Intelligence, presently working as Enterprise Architect of the largest Financial Services Cloud in Africa continent and guiding the program both in AI and Salesforce journey using Design Thinking and Agile methodologies.

Nicolai Johnson-Borelli

View Profile

Nicolai Johnson-Borelli

Minneapolis, United States of America
Data-driven Salesforce consultant specializing in CRM Analytics and Salesforce Einstein. Passionate about machine learning, predictive analytics, and all things Salesforce.

Parth Ravani

View Profile

Parth Ravani

Pune/Hyderabad, India
Parth Ravani is an accomplished analytics professional currently holding the role of Principal Analytics Developer at Egen, FKA SpringML. He is forging his path toward becoming a Salesforce Architect. Parth's expertise spans a wide spectrum, including Salesforce, CRM Analytics, ETL, data modeling and the art of creating insightful visualizations and dashboards. He thrives in simplifying complex data landscapes and transforming them into actionable insights. Beyond his professional life, Parth is a multifaceted individual. He finds immense joy in his creative pursuits like singing, songwriting, and skillfully strumming his guitar. These hobbies offer a welcome contrast to his analytical work, providing him with a means to express his artistic side. Parth Ravani continues to make strides in the field, blending his skills and passions to create a harmonious professional journey.

Paul Liu

View Profile

Paul Liu

Suzhou, China
Paul Liu is a Salesforce Certified Einstein Analytics and Discovery Consultant and a Salesforce Certified Application Architect, he has 17 apps published on Salesforce AppExchange including two CRMA related Apps - Dataset Writeback for Tableau CRM (https://appexchange.salesforce.com/appxListingDetail?listingId=a0N3u00000MS1FjEAL) and Recipe Output for CRM Analytics (https://appexchange.salesforce.com/appxListingDetail?listingId=a0N4V00000Hs4jqUAB). Paul is also a blogger who has published 40+ articles on LinkedIn and 50+ videos on youtube. He was featured on the Salesforce AppExchange and the Salesforce Ecosystem blog sharing his Trailblazer experience, his apps, and what he's learned along the way in April 2021 (https://medium.com/inside-the-salesforce-ecosystem/salesforce-developer-appexchange-49b708e37bfd).

Phillip Schrijnemaekers

View Profile

Phillip Schrijnemaekers

São Paulo, Brazil
Salesforce Consultant at riverBI. An adept professional in data solutions, specializing in CRM Analytics and Tableau. With a profound understanding of Salesforce and data analytics tools, I collaborate with clients to implement solutions that convert raw data into actionable insights, optimizing customer relationship management. Also, completely passionate about music and aviation.

Prabhat Mishra

View Profile

Prabhat Mishra

Mumbai, India
Prabhat is a Senior Consultant at Deloitte, where he specializes in CRM Analytics implementations & development. He is a seasoned business analytics professional with over 10 years of experience in turning data into reliable insights, real time action, business value and a strategic competitive advantage. Having extensive experience in Service, Aviation and Healthcare & Life Sciences industries; Prabhat has a track record of enabling data driven decision making & unlocking potential value of data at scale.

Pranit Bhisade

View Profile

Pranit Bhisade

Pune, India
Hi I am Pranit, I am working as CRM Analytics developer at Carelon Global Solutions Hyderabad India. I am passionate about data , ML, Analytics, CRM. My hobbies are biking and trekking.

Preena Johansen

View Profile

Preena Johansen

Brisbane, Australia
I am an experienced data and analytics professional that is grounded in integrity, has a strong capacity to learn, the energy to get things done and brings diverse, real world experiences to support innovative thinking. With Data and AI in the Salesforce CRM Analytics platform I bring a technical product understanding, industry experience and industry best practices to define the product vision and strategy to meet business objectives. I celebrate diversity and inclusion and strive to foster an inclusive culture supporting other trailblazers find their path.

Rajlaxmi Rath

View Profile

Rajlaxmi Rath

Manchester, United Kingdom
I am a Salesforce Consultant / Solution Architect at Accenture UK&I. Currently 11x Salesforce certified, I specialize in Sales Cloud/CPQ, Service Cloud, CRM Analytics and Marketing Cloud Account Engagement (Pardot) - aspiring to be a Salesforce Application / System Architect. I enjoy building and designing solutions leveraging Salesforce products - especially CRM Analytics. I am also fond of analyzing data and making sense out of it and providing actionable insights to the end users. Constantly looking to learn something new.

Ramdoss K

View Profile

Ramdoss K

Chennai, India
I am seasoned business Intelligence analytics /Data Analyst professional with strong analytical and interpersonal skills. experience in turning data into reliable insights, real-time action, business value, and strategic competitive advantage. I approach business challenges systematically and logically while maintaining a creative approach, to reach solutions that both are innovative and usable.

Ray Espinoza

View Profile

Ray Espinoza

Lima, Peru
Ray grew up in Lima, Peru. He earned a bachelor's degree in computer science and an MS in Data Science at the University of Navarra in Spain and is currently living in Maryland. He is passionate about Data Science and Analytics projects. Day in and day out, he strives to combine math, analytics, coding, and storytelling to make data easy to understand. Additionally, he enjoys sharing his knowledge and experience to help others within the Tableau community. He loves watching movies and playing tennis.

Sayantani Mitra

View Profile

Sayantani Mitra

Chicago, United States of America
I am a Senior Data Scientist in Chicago at Conservice LLC. In this role, I am responsible for everything related to CRM Analytics, including dataflows, recipes, connectors, and dashboards, and launching them into Service Cloud or Experience Cloud. Furthermore, I am a CRM Analytics Ambassador (former #AnalyticsChampion) and Salesforce Certified CRM Analytics and Einstein Discovery Consultant, I love #AllThingsData (I love working with messy data!) and write blogs about CRM Analytics (https://medium.com/crm-analytics) as well as host Chicago CRM Analytics Meetups. As a team leader for more than eight years, I analyzed vast modules of environmental data and presented findings to local residents, and state and federal agencies before pursuing my master's in Applied Urban Science and Informatics at New York University. I have also presented at various other meetups and conferences including Dreamforce.

SIVAKRISHNA. MARRI

View Profile

SIVAKRISHNA. MARRI

New Delhi, India
My name is SIVAKRISHNA MARRI, and I work as a LEAD CONSULTANT with HCLTECH, Delhi INDIA. Professionally, I have 10 years of experience in the IT industry. I have been assisting end users for the past four years by providing the greatest data insights, and I have served more than seven clients independently. I am really interested in data and analytics, and I enjoy solving challenging business problems. My wife Gayatri Sharma her linkdin bio (https://www.linkedin.com/in/gayatrisharma88/) introduced me to Tableau and CRM Analytics (Einstein Analytics at the time) in 2019, and I've been fully absorbed in the Salesforce ecosystem ever since.

Spandana Jagtap

View Profile

Spandana Jagtap

Fairfax,Va, United States of America
Spandana Jagtap is a Washington D.C based Data and Analytics consultant with a passion for transforming raw data into actionable insights. She has a strong background in data visualization and predictive analytics. She holds a master’s degree in data science and has worked with diverse industries, leveraging data driven tools (CRM analytics, Tableau) for informed decision-making. She specializes in building complex CRM Analytics solutions for various use cases. As a leader of the global Tableau Community at Slalom, Spandana is a firm believer in the power of data to revolutionize industries and is committed to making data-driven solutions accessible and impactful.

Sunil Bhardwaj

View Profile

Sunil Bhardwaj

Faridabad, India
Sunil Bhardwaj is a Salesforce Architect with more than Ten years of CRM experience. He has done his Masters in Biotechnology. He is a professional in CRM Analytics, Data Analytics and Business Intelligence and passionate about logic and learning. He is a CRM Analytics fanatic and his goal now is to give back more and more to the CRM Analytics Community by helping beginners and experts find analytical solutions. He enjoys helping people and being a Trailblazer. Sunil is inspired daily by his family. In his free time, Sunil likes to travel to learn new foreign languages and culture and play games with his kids at home.

Sweta Rai

View Profile

Sweta Rai

Morrisville, United States of America
Sweta Rai is a Senior Principal Analytics Consultant at Egen (formerly SpringML Inc.) where she transforms data into strategic insights. She is a 9x Salesforce Certified Professional. With more than 9 years of experience in CRM industry, she specializes in designing and developing dashboards for stakeholders which gives them feasibility in good decision making. She has experience in creating visualization starting from data preparation. This experience has led her to collaborate with diverse teams where she has developed the ability to connect dots between technical issues and business objectives.

Tim Dries

View Profile

Tim Dries

Scherpenheuvel-Zichem, Belgium
Tim Dries, a Technical Consultant at Biztory in Belgium, has over a decade of experience in dashboard and data analytics. He specializes in Tableau, Einstein Discovery, and CRM Analytics, helping companies maximize their data's value across industries. Beyond work, he enjoys playing guitar, eating, fixing old Gameboy consoles, and running.

Varun Gulati

View Profile

Varun Gulati

Noida, India
Varun Gulati is a seasoned Salesforce DevOps Architect, with an overall 13+ years in the CRM ecosystem. As a Certified Salesforce Tableau CRM and Einstein Discovery Consultant, he crafts data-driven CRM excellence. Varun champions security and aids CRM Analytics Governance, translating business needs into solutions. His robust CRM analytics skills make him the go-to expert for problem-solving, ideation and implementation. Beyond his professional prowess, Varun passionately gives back to the community through active participation in CRM Analytics Official Trailhead Groups and enlightens viewers through his YouTube channel "forceOps" (https://www.youtube.com/forceops).

Will Heikes

View Profile

Will Heikes

Philadelphia, United States of America
Hi! My name is Will Heikes, I'm an Analytics Manager at Atrium. I've worked with CRM Analytics since the product's creation, and expanded into Tableau work two years ago. My favorite things about working with analytics are the dashboard design process and unraveling complex data structures. Outside of Atrium, I'm the author of Red Analytics, a blog aimed to teach newer developers the tips and tricks to developing great dashboards in CRMA and Tableau! I currently live in Philadelphia, Pennsylvania, and love to bake, garden, and build Lego. Feel free to reach out, I'd love to chat!