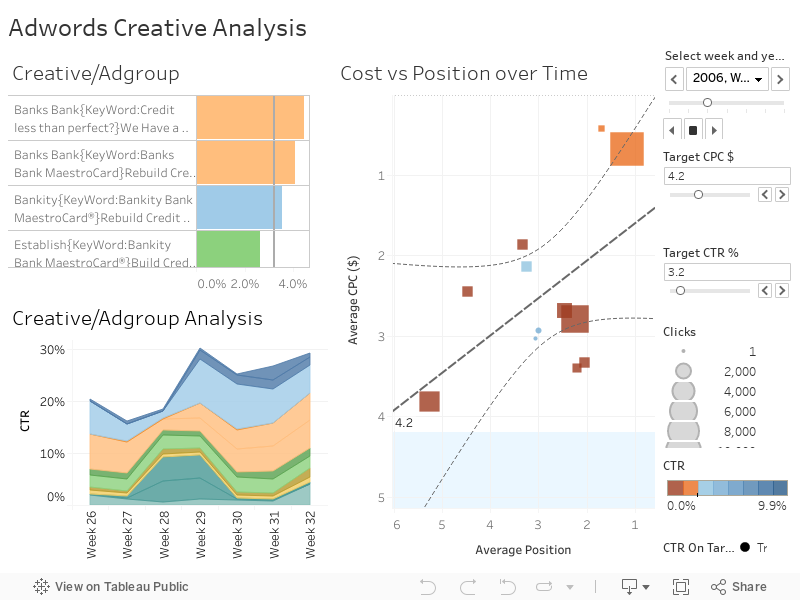
Analyze AdWords data to uncover website traffic trends
We only measure that which changes. Tableau makes time series speak volumes with interactive tools and visual clarity. In this visualization of website traffic, you can see multiple weeks at once or zoom into a single week. Pageviews per visit, conversion rate, and visitor counts are clearly visible in the charts at the bottom. Hover over any point to see granular data.