Determine stock volatility using candlestick charts
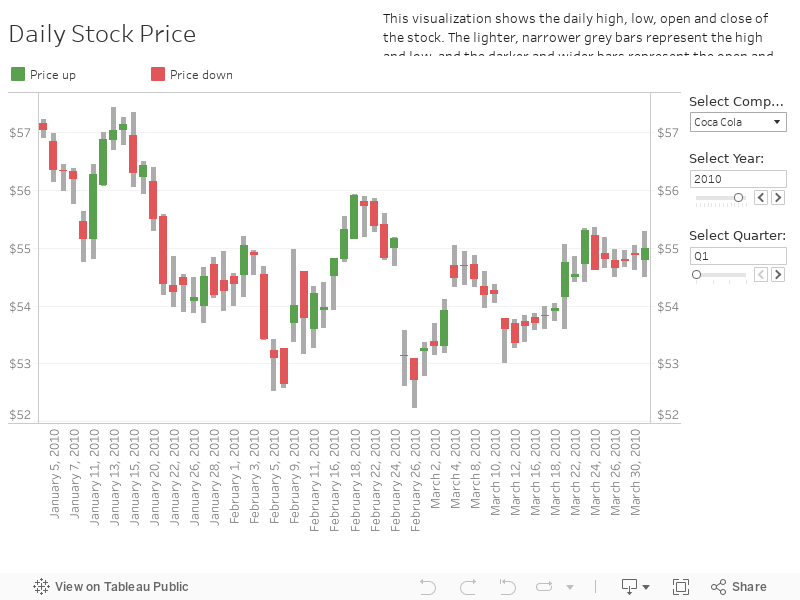
With Tableau, anyone can create impactful visualizations of stock data to find opportunities and risks. For example, candlestick charts are a mainstay of financial analysis. They enable you to perform price and volatility analysis in one view, and they're easy to make in Tableau. In this candlestick chart, you can track Coke's or Pepsi's stock price in one compact and powerful view.
Financial Analysis with Tableau
Learn how to gain deeper insights and uncover hidden trends using Tableau.