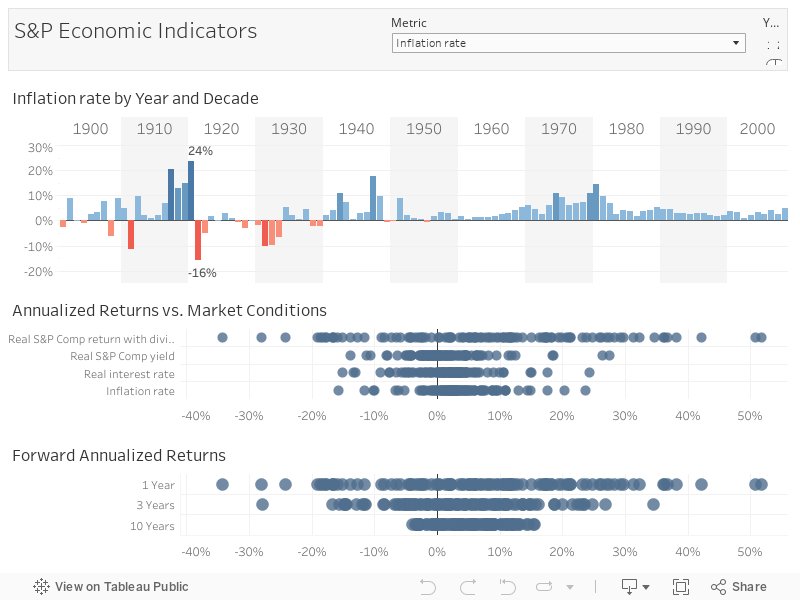
Identify the long-term drivers of the US economy
Economics has been called "the dismal science," but with Tableau, it becomes fascinating to explore. This visualization presents key economic indicators and stock market returns for the past hundred years. Selecting a point highlights all metrics for that year, showing it in the context of the complete century. Experience a hundred years of US economic history at a glance.