Genesys: Gaining valuable insights at the click of a mouse
More than 100 million customer interactions each day are facilitated through Genesys customer experience and contact center solutions. With more than 40 worldwide offices and more than 3,500 customers in 80 countries, Genesys works to deliver seamless, tailored customer experiences across multiple channels. In 2010, Genesys planted the seeds for a company-wide data revolution: the Genesys business intelligence (BI) team was established.
Starting Small, Thinking Big
The brand new BI team needed to show the business the value a dedicated business intelligence effort could offer. And the opportunity to impact the business was huge.
“I remember an executive—he was dealing with an organization of 3,000 people at that time—and he told us ‘I need more information about who is working on what, how much I'm spending, what's the status of a project, what is the number of products, or even the number of employees!’” says Jean-Paul Saliou, Senior Director of Business Intelligence and Applications at Genesys.
Unfortunately, the challenges facing the team were great as well. The new team did not have access to BI-specific tools, so they worked with already-available technologies such as Microsoft Excel and SharePoint.
“The first months were about having proofs of concept and doing some homegrown things,” remembers Saliou. “It was really about starting small, but thinking big. That’s where we started with BI overall.”
The team quickly decided to look for better tools to manage and communicate the company’s data.
“We evaluated a few pieces of software and Tableau was one of them. We downloaded a trial and tested it. We were surprised—in a good way,” remembers Nicolas Gousakoff, Senior Business Intelligence Analyst at Genesys. “It was almost shocking, that we didn't find any limits to Tableau.”
In addition to Tableau, the BI team also considered QlikView and Jaspersoft.
The business intelligence analysts wanted to purchase Tableau, but the nascent team’s budget didn’t match their vision. Instead they built the first BI platform at Genesys using open source technologies.
It took approximately a year to build a library of dashboards and reports.
Victims of Success
“We were doing everything,” explains Gousakoff. “We worked with the business on requirements, going back-and-forth, and then we created the dashboards entirely from scratch.”
Genesys business users and executives welcomed the data with open arms, and demand quickly outstripped the team’s ability to produce.
“We were a victim of our success,” says Saliou. “Unless we were going to hire more developers to work on the homegrown solution, we couldn't scale.”
The team hoped that a new BI platform would provide much-needed scalability while also addressing other issues. For example, some reports only updated monthly—so decisions might be made based on month-old data.
They also needed to meet an executive mandate to help Genesys become more data-driven across the company. As part of that effort, the BI team wanted to provide the Genesys sales team with a “one-stop shop” for customer data insight.
“We needed to create 360-degree customer view and have it accessible within Salesforce,” Gousakoff says.
Taking the Next Step
The time was right to revisit Tableau.
“We purchased a few Tableau Desktop licenses, and we decided to replace what had spent the previous year building and developing,” says Saliou.
The team was able to complete that task quickly, which garnered support for a larger deployment of Tableau, including a Tableau Server core implementation for publishing and sharing visualizations.
“With Tableau Server, everybody in the company could have access to what we build,” says Saliou.
The team quickly realized that they could ease their workload by training business teams to author their own Tableau visualizations. Today, Genesys has more than 30 Tableau Desktop licenses across the company and hundreds of users consume published dashboards and visualizations through Tableau Server.
The BI team has also been able to provide that “one-stop-shop” customer view to sales by embedding a Tableau dashboard into the company’s Salesforce platform.
“The 360-degree customer view provides almost a real-time view of what the customer has or needs. We have included information pulled from our systems—ERP, CRM, defect tracking and so on. We have also allowed some homegrown algorithms. ‘Can we sell more to this customer?’ Or productivity analytics. It gives us a sense about what a customer needs and if we can do more for the customer,” explains Gousakoff.
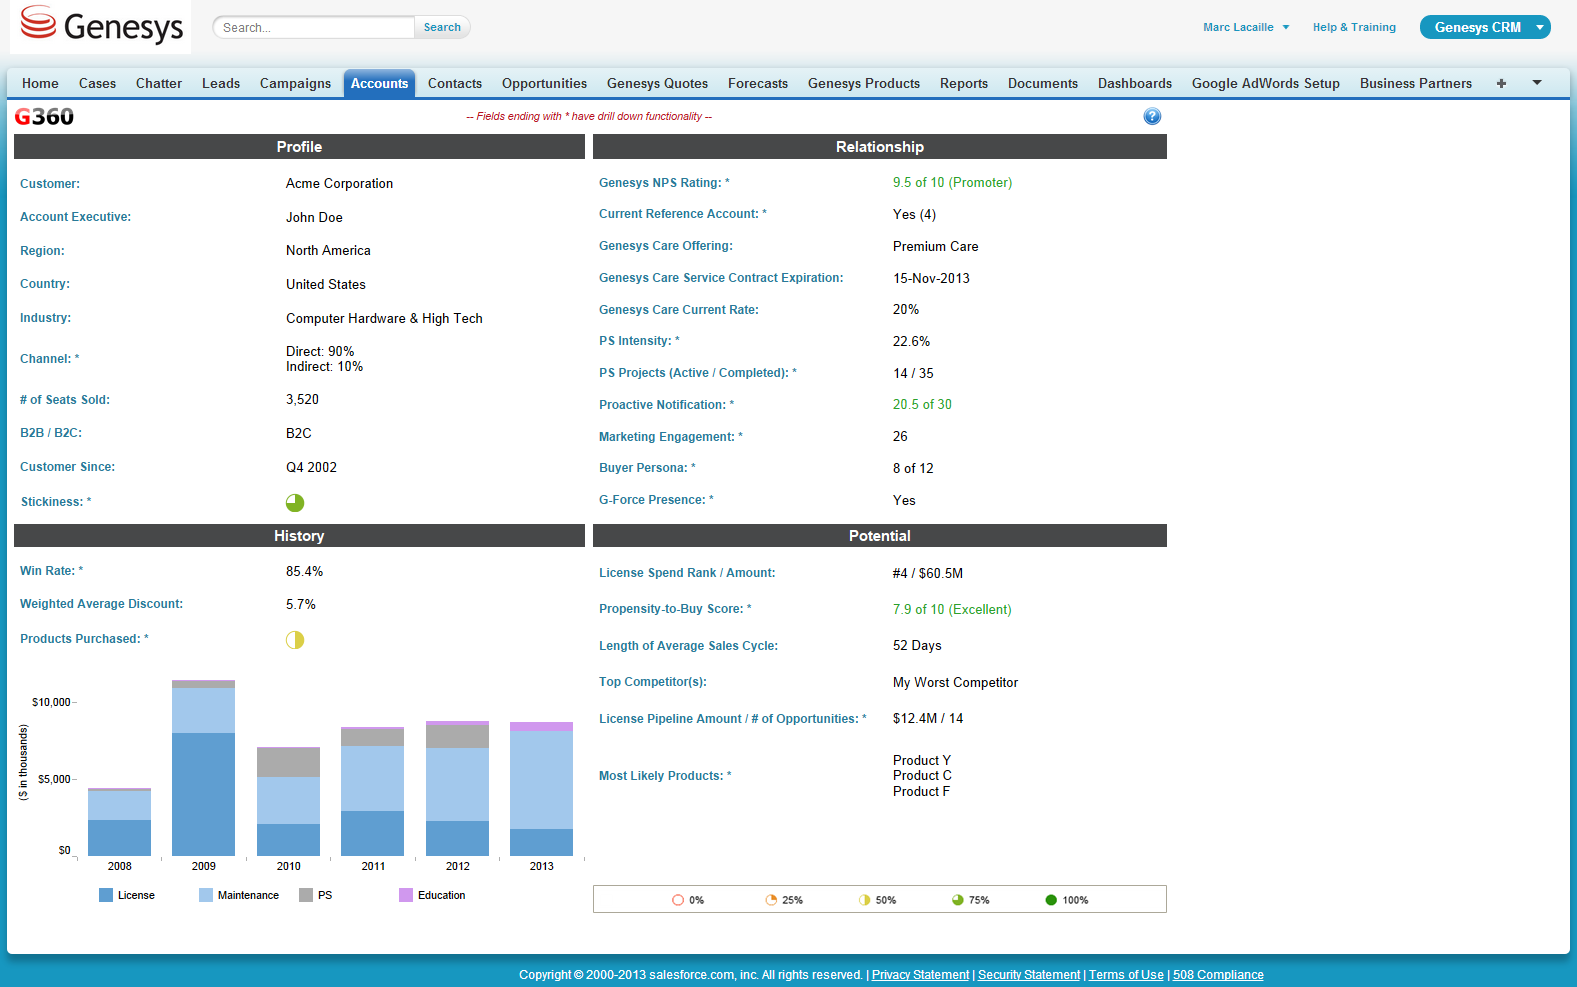
360-degree Customer View in Salesforce
“It is available to all of the employees in offices across the world.” he says.
The team optimized the dashboard for mobile, knowing that many salespeople would be accessing it from iPads and other tablet computers.
“That’s very helpful; we want to be sure there would be no reason for them not to access the dashboard,” says Saliou.
Using Tableau, we were able to replace in a matter of a few months what it took us a year to build before. The business was amazed.
Benefits
“Our executive team has had a clear goal for Genesys to become more data-driven across the company,” says Saliou. The BI team has used Tableau to help accomplish that goal in many ways, including:
- Improving global communication. Genesys displays Tableau dashboards on large displays in several of its international locations. The dashboards can visualize information about employees, products or customers. “It is really helping to provide more exposure to data,” says Saliou. “It’s a way of pushing the data to users rather than waiting for them to ask.”
Building on this, Genesys will be embedding a number of Tableau dashboards within its new intranet, launching soon.
- Accelerating insight by months. Today, business users are able to make decisions based on near real-time data. “In the past, we had to make decisions and in some cases we could only see a monthly dashboard. Now, our dashboards are updated daily or even twice daily,” Gousakoff says.
Remembering back to that conversation with a Genesys VP, Saliou says with a laugh, “Our VP a few years ago was flying blind. Now we have access to information in a couple of clicks.”
- Amplifying the efforts of a small team. Saliou credits Tableau with helping his five-person team support the entire company. “We are a lean team. If we did not have Tableau, we would not be able to scale; we could not satisfy the business requirements,” he says. If the team continued to use the open-source platform, he estimates that he would have to triple his team to support users at the same level.
Saliou particularly appreciates that Tableau’s self-service capabilities allow business users to answer their own questions in many cases. “We told the business, ‘you know what you want and now you can create your own views,’” he says.
- Speeding project timelines by months. “Using Tableau, we were able to replace in a matter of a few months what it took us a year to build before,” says Saliou. “The business was amazed.”
And while many units are helping themselves through self-service data visualization, the Genesys BI team still creates vizzes for groups and executives across the company.
“Previously, the time to design, develop, and then redesign reports and graphs, it would take a month or more. Producing the same view with Tableau—even considering the need to build the view and pull the data from the source— would take a matter of days,” says Gousakoff.
- Moving from reactive to proactive responses. Data insight powered by Tableau is helping business groups take the initiative rather than waiting to respond to events.
“Take the example of the customer view window,” says Gousakoff. “People in the sales organization can see when we face the risk of a customer running escalation or super issues. So they can call the customer and tell them, ‘I see you have an issue, and we’re working on it.’”
All of these benefits are serving the ultimate Genesys goal of constantly exceeding customer expectations.
“It's about the overall customer experience—to continue to leverage our data to be increasingly customer-focused. Tableau helps us do that,” says Saliou.