Subject Area: Architecture
Level of complexity: Beginner
Approximate Time to complete: 10 minutes
Companion Workbook (twbx): n/a
Additional Resources on the web:
- http://onlinehelp.tableau.com/current/pro/online/en-us/help.htm#inspectdata_viewdata.html
- http://kb.tableau.com/articles/knowledgebase/view-data
The View Data command lets you display the values for each row in the data source that compose the marks. It also shows you the summary data based on the aggregations in the view. You might want to do view data to verify the aggregated value associated with a mark, or to isolate and export the individual rows associated with data of interest such as outliers. This option is provided on several Tableau products although the behavior on each will be slightly different.
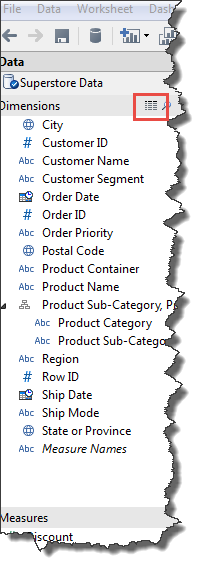
This document will review the "View Underlying Data" options for Tableau Desktop, Tableau Server, and Tableau Reader. Regardless of the platform you are using the symbol you or your users are looking for is this:

...selecting this at any point will pop open a new window with the detailed information for your dataset (in Desktop) or the mark(s) you selected.
Tableau Desktop: In Tableau Desktop you can View the underlying data in two locations the first is on the Measures and Dimensions Pane on the left hand side of the UI.
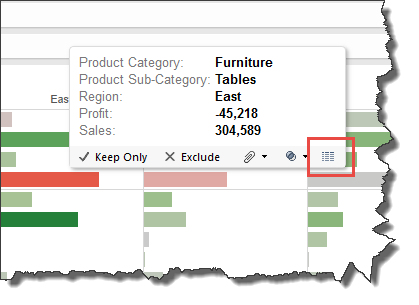
The second is located on a tool tip when you hover over a mark:
Viewing from the Measures and Dimensions Page – This will display the data for all columns within a particular data source.
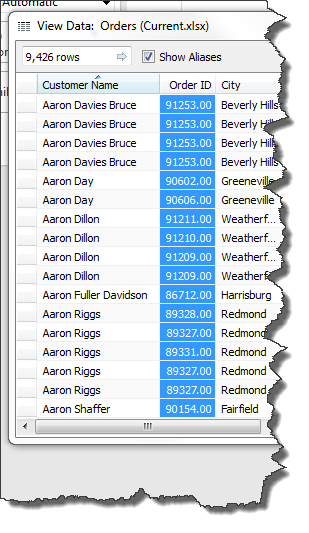
By default, Tableau Desktop will only display the first 10,000 rows of data to change this you can enter the desired number of rows into the text box in the top left corner.
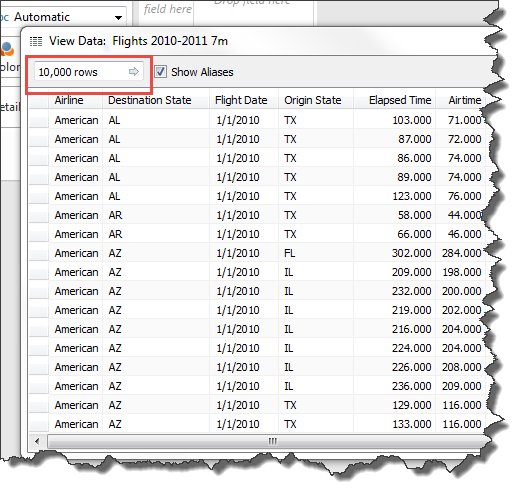
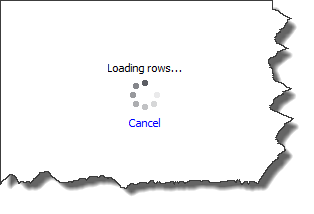
This will prompt Tableau to send a query back to the data source and call additional rows. The performance of this will be impacted by the speed of your data source for example a user calling 10,000,000 rows of data will experience a slower load time and will be presented with the option to cancel this action.
Users often find it useful to interact with the underlying data to make it easier to process for example clicking on the header for a column will allow you to sort either ascending or descending based on that field's value. Users can also drag fields around within the window to call attention to what they are most interested in comparing. For example in this view the data is sorted based on alphabetical order of customer name and Order ID was placed next to customer name for easy reference.
At any point you will also be presented with the option to "copy" the data. Users can highlight a selection of rows and columns to copy and paste this data either into another tool or back into a Tableau workbook.
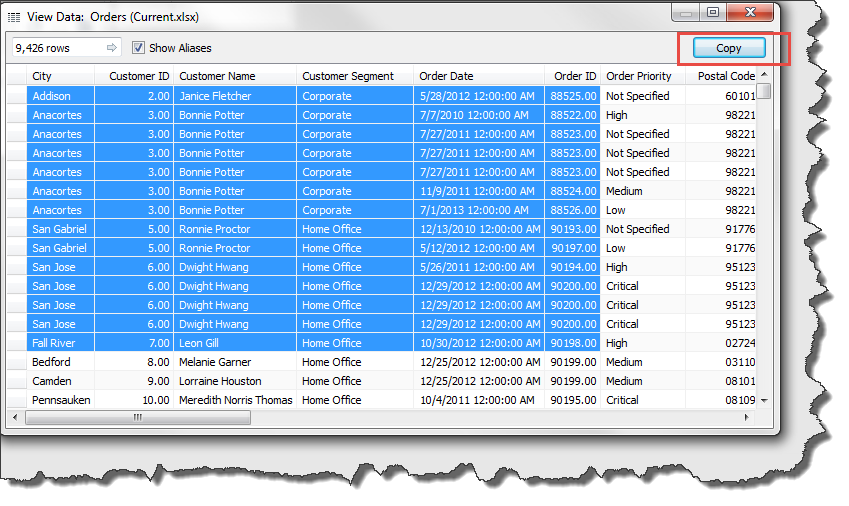
The last option for any "View Underlying Data" option on Tableau Desktop is to "Show Aliases". This applies if a Tableau User has edited the alias (http://onlinehelp.tableau.com/current/pro/online/en-us/datafields_fieldproperties_aliases_ex1editing.html) of a particular field and you wish to see the original underlying data rather than the user designated alias.
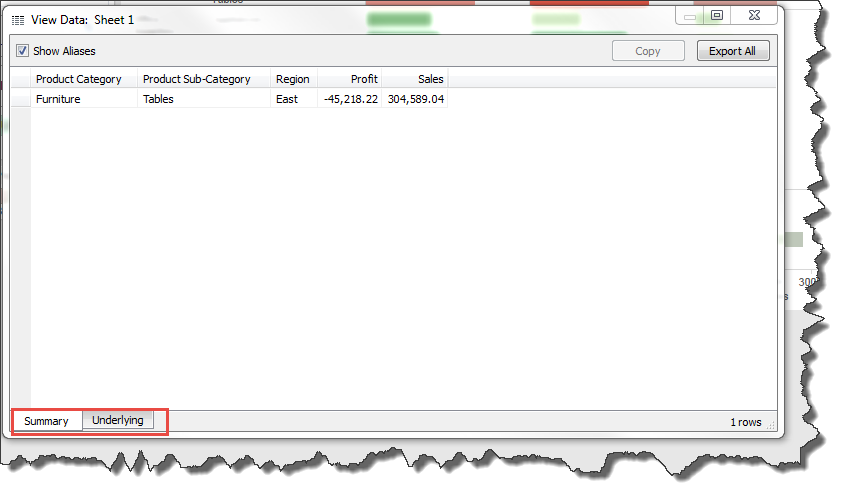
Viewing underlying data from a mark or group of marks in Tableau Desktop – This provides the above functionality and additionally provides access to a "Summary" data tab and the options to "Show all fields" or "Export All" data.
The Summary data tab is helpful for Tableau Users who want a quick tabular view of the mark they selected in a view.
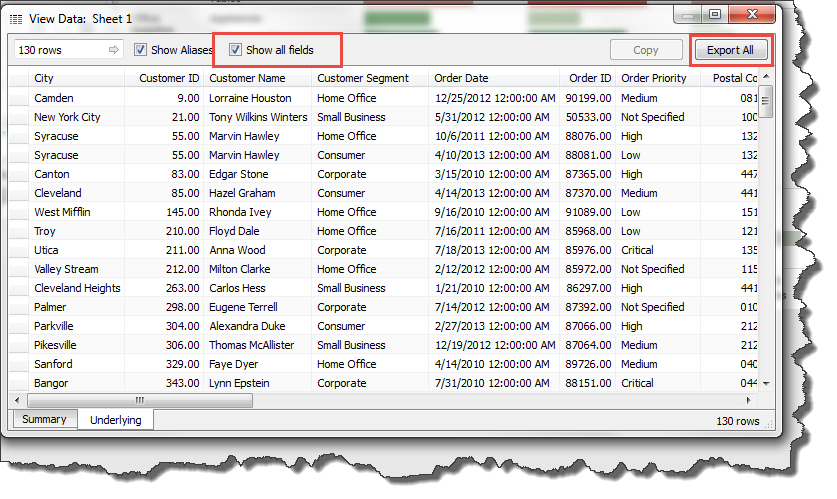
The Show all fields check box is an easy way to limit the number of columns of underlying data a user is looking at to just those that are relevant to a particular visualization.
Selecting "Export all" will allow a user to save the current view of the underlying data as a .CSV file.
Viewing the underlying data from Tableau Server
Users of Tableau Server are able to view the underlying data from a tool tip for a mark or a group of marks as you can in Tableau desktop. This option will open an additional browser window first showing the summary data with a tab to select the underlying data. Unlike Tableau Desktop, on Tableau server the view underlying data option will default to just the relevant columns for a particular view with the option to view additional fields by selecting "Show all columns". You also lose the ability to sort and rearrange columns on Tableau Server.
Users also have the ability to export the data as a .CSV file by selecting "Download all rows as a text file"
The max number of rows for view underlying data on Tableau server is 200 rows for a solution to view all underlying data see "Drilling to detail using actions" or users must download the underlying data to a .CSV file.
Viewing the underlying data from Tableau Reader
Tableau Reader does not provide the option for you to view the underlying data – However users are able to unzip the packaged workbook they receive and access the underlying data that way. Some users consider this a benefit while others consider it a security liability to distributing visualizations via Tableau Reader as opposed to Tableau Server.
Other Limitations and options
The View Data command works with all relational and multi-dimensional databases except Oracle Essbase and SAP® Business Information Warehouse databases; To allow users to access detailed data for an either of these see instructions for "Drilling to detail using actions".
While you can view data with the Microsoft Analysis Services and the Teradata OLAP connector multi-dimensional databases, the database must be drill-through enabled and there are some restrictions to the data you can see.
When viewing the underlying data on Tableau Server you are limited to 200 rows of data
Turning off the View underlying data option – The command buttons on the tool tip are visible by default. To disable these click Tooltip on the Marks card or select Worksheet > Tooltip and then clear the Include command buttons checkbox in the bottom left corner. Tooltip settings apply to the active worksheet and can be different for each worksheet in the workbook. (http://onlinehelp.tableau.com/current/pro/online/en-us/environ_workspace_tooltips.html)