How to create a small-multiple tile map


Note: The following is a guest post by Tableau enthusiast Matt Chambers.
I recently saw an article posted by Alberto Cairo in which someone had built a map of Scotland using tile maps built of Sankey diagrams. I thought it was pretty cool, so I wanted to be able to do something similar in Tableau.
Since I have built hex maps before, and Brittany Fong has built tile maps, I already had an idea of how to do this. Let's take a look at how this is done.
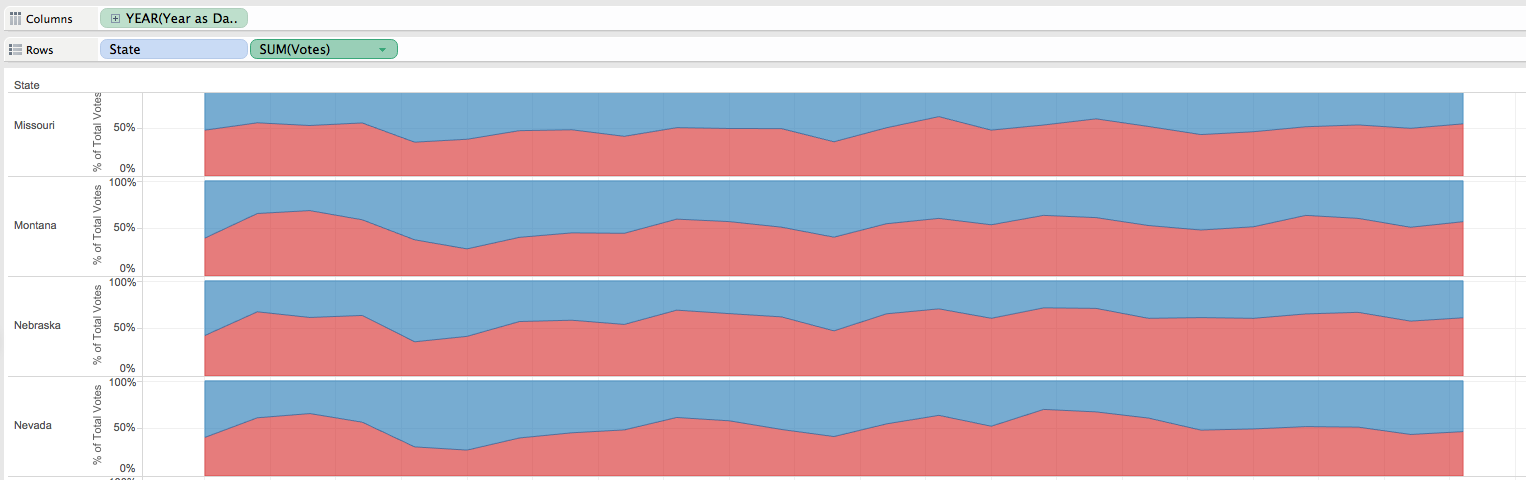
Step 1: The first thing we need to do is build an area chart where we have some data segmented by state and time. In this case, we are using percentages of votes for Democrats and Republicans in presidential elections.
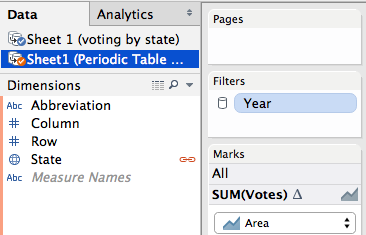
Step 2: We need another data source to blend with so that we can get the layout for the tiles. I downloaded Brittany Fong's template file. Connect to the data source and make sure that your data set can blend on state or abbreviation.
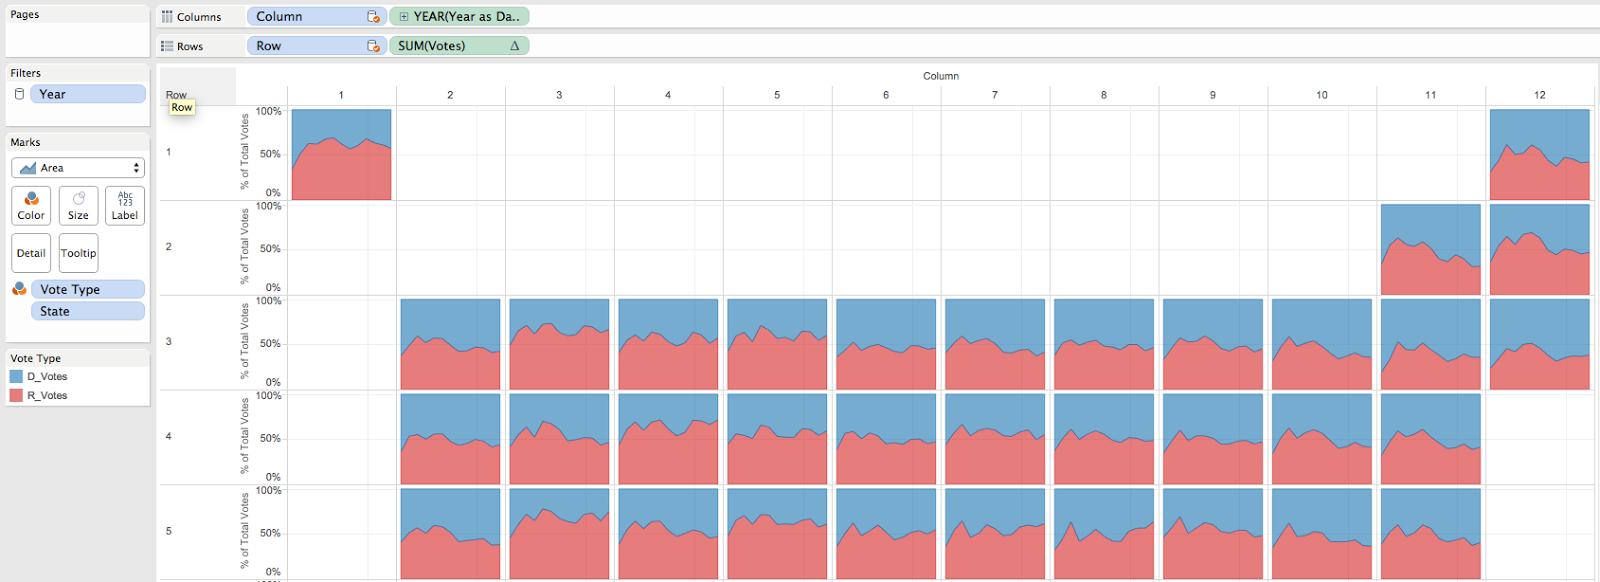
Step 3: Drag Column to Columns and Row to Rows. Move State to Detail.
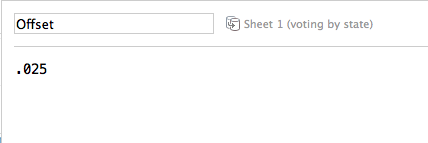
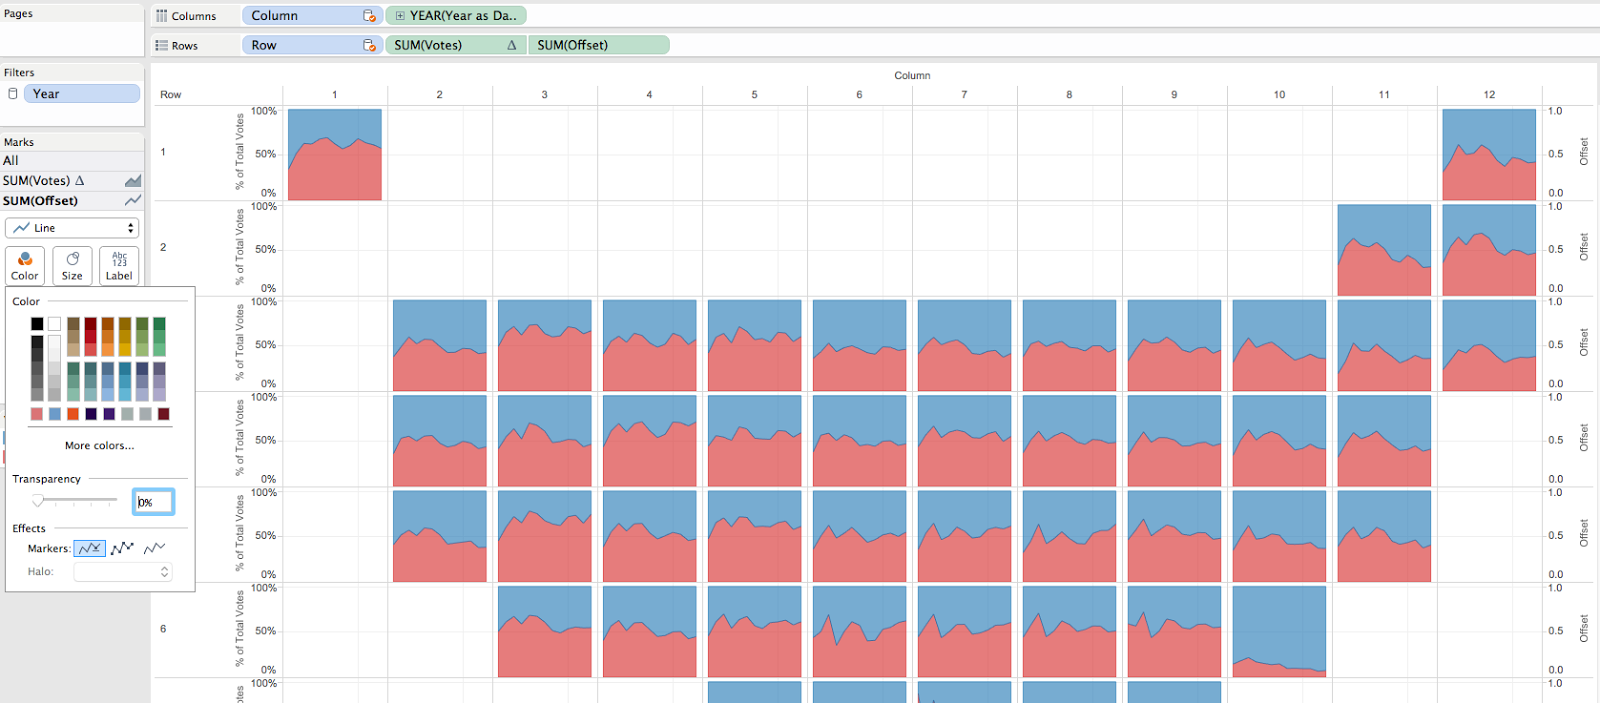
Step 4: Now we need to label the tiles. To do this, we need to create a secondary axis. Create a calculated field called "Offset" and give it a value of .025.
Step 5: Drag offset to Rows, enable dual axis, and synchronize the axes. Set the mark as a line and reduce the color transparency to 0%.
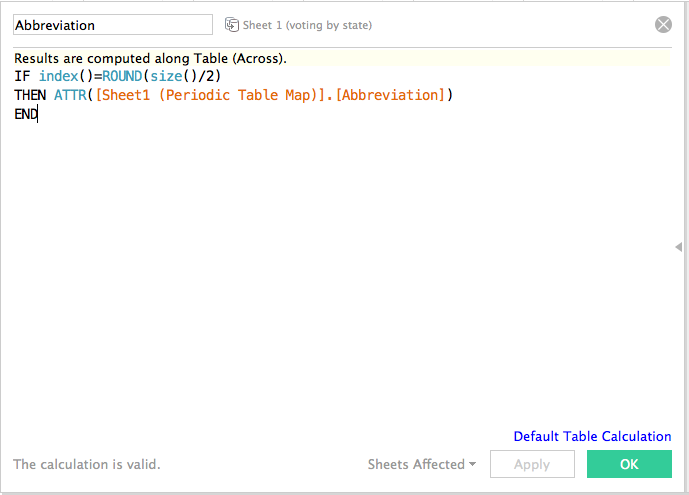
Step 6: Now that we have a line to which we can add our label, we need to create the calculation to display the abbreviated state name on the tile. We need to pull in the abbreviation from the secondary data source. Create the following calculated field:
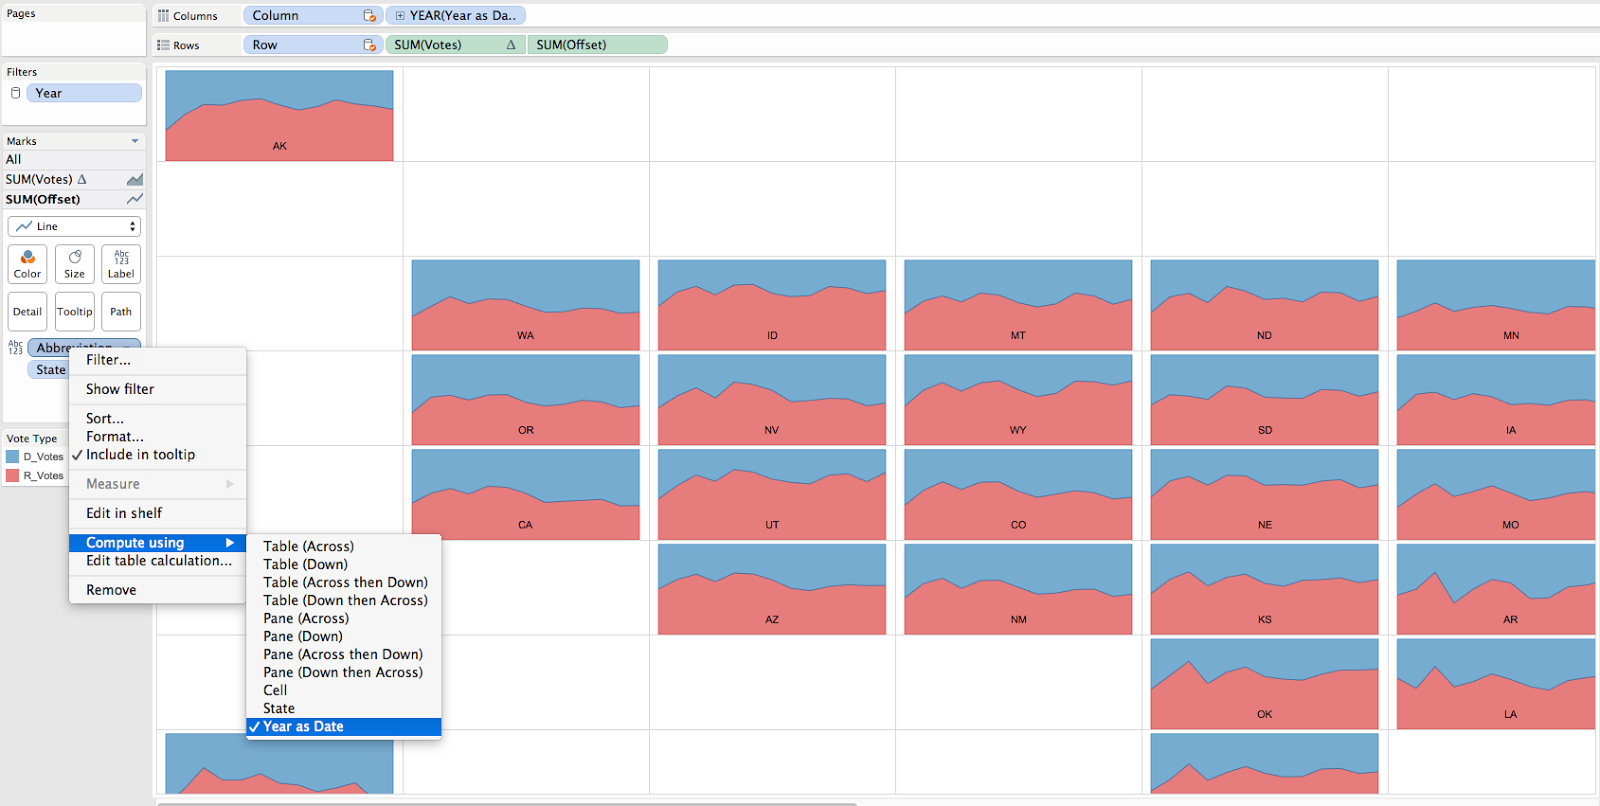
Step 7: Change the date on the columns to discrete (blue pill). This allows the columns to have the proper width and looks nicer overall. Drag the Abbreviation calculation to the label of the offset line and make sure it is calculating using your date.
Step 8: Hide the headers and remove all borders. Drag the worksheet into your dashboard and size appropriately. I added a blank space above the map that is 135 pixels to get the dimensions I liked.

That's it! Hopefully this will help you build this type of viz. Feel free to download the workbook or comment with any questions.
For more tips, ideas, and vizzes by Matt, check out his Tableau Public page and his blog, Sir Viz-a-Lot. You can also connect with him on Twitter @sirvizalot.
Histórias relacionadas

Visualizing Women's Impact to History Through Data Visualization
 18 Março, 2024

Behind the Viz: Adrian Zinovei Helps You Design Your Next Dashboard
1 Março, 2024

Charting the Heart: Data Visualizations on Love
 14 Fevereiro, 2024
Subscribe to our blog
Receba em sua caixa de entrada as atualizações mais recentes do Tableau.