Why tell stories with data?
Stories have impact, create memories, and lead a viewer down a chosen path. Matt Francis explained when to use data stories in his TC On Tour session in London.


Stories have impact, create memories, and lead a viewer down a chosen path. Matt Francis explained when to use data stories in his TC On Tour session in London.
Matt is a senior software developer at the Wellcome Trust Sanger Institute and an active Tableau blogger/tweeter/video maker.
Most dashboards are built for exploration and are generally neutral. They allow a user to go on their own journey of self-discovery.
Matt outlined situations where you want to achieve something else with visualisations:
- You want to reveal facts and data points in a specific order.
- You want people to feel a certain emotion.
- You want to make case for change.
He calls it sequential data visualisation and he illustrated his point with three of his own examples. Some use Tableau’s new 8.2 Storypoints features; others were built in a particular way to tell a story.
Sunspots
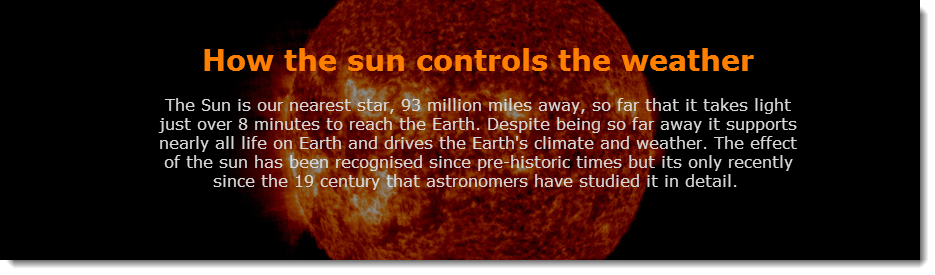
(click to visit the live version)
This isn’t so much an “emotional” story but a series of different points ordered to reveal particular information about sunspots.
Who’s the best Formula 1 driver?
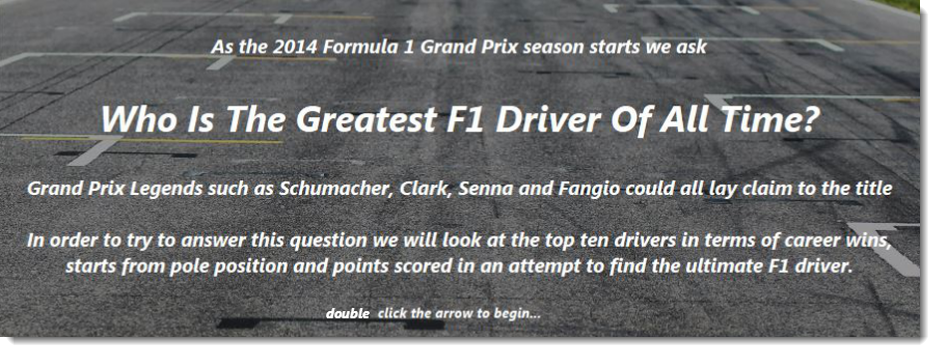
(click to visit interactive version)
This was an entry into one of our Iron Viz contests. Instead of just showing a dashboard of data about drivers, Matt told a story, revealing different facts about drivers at each stage. He used this technique to drive people to his own conclusion, that Juan Manuel Fangio is the greatest F1 driver of all time.
Malaria – a global preventable disease
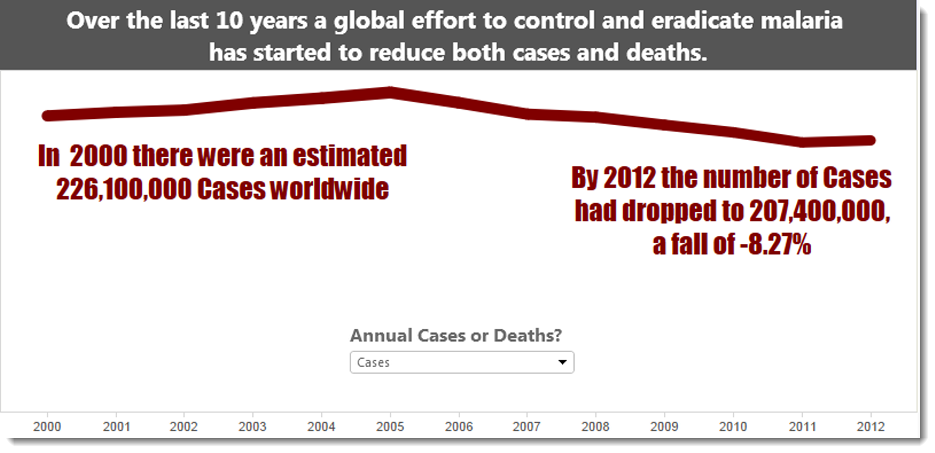
In this example, Matt is using emotional stages in a story to drive people to change: to get them to donate to Malaria causes. There are several factors that make this work as a data story.
- The vertical nature makes it work well in a web page
- He brings in other data to make the facts about malaria more relatable (for example – did you know a long lasting insecticidal net is cheaper than one trip to the cinema?
- He’s not afraid to use text. Charts tell a large part of the story but they shouldn’t be completely isolated. You can use text to add context and instruction.
You can find more by Matt on his blog (wannabedatarockstar) and via his Twitter account (@matt_francis)
Histórias relacionadas

How Team USA uses data to build a digital HQ
 8 Fevereiro, 2022

Tendências de dados que causarão impacto em 2022
 3 Fevereiro, 2022

Healthcare Analytics Hub Starter Kit: Get the data you need faster
 18 Outubro, 2019
The purpose of the Healthcare Analytics Hub Starter Kit is to provide a sample of what your healthcare app could look like. It’s not a complete solution; instead, it’s focused on what’s possible. Please contact your Tableau Account Manager to get started today!
Subscribe to our blog
Receba em sua caixa de entrada as atualizações mais recentes do Tableau.