Optimizing your Amazon Redshift and Tableau Deployment for Better Performance
Download this free whitepaper
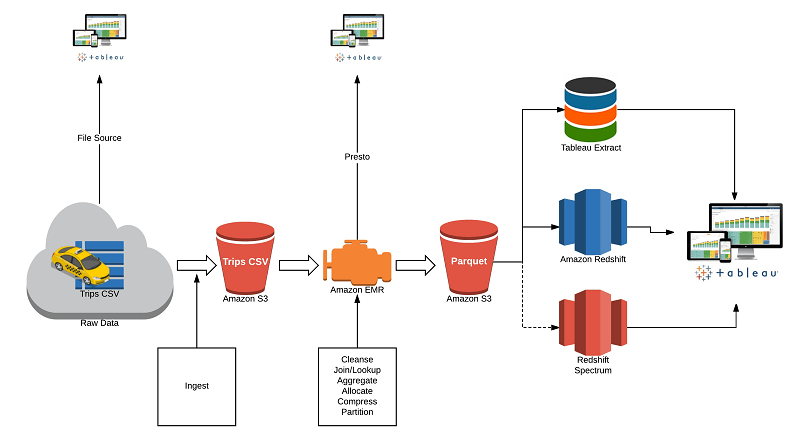
Amazon Redshift and Tableau are two powerful technologies in a modern analytics toolkit. Combined, they form a data warehousing and analytics solution that allows users to analyze datasets, running into the billions of rows, with speed and agility to drive better business outcomes. They are integrated out-of-the-box, so you can connect Tableau to your Amazon Redshift data warehouse with minimal time or effort. It’s important to understand how to optimize when integrating the two together, and doing so can yield considerable performance gains and ultimately shorten deployment cycles.
This paper introduces infrastructure advice as well as tips and hints to make the joint solution more efficient and performant.
Get the whitepaper빅 데이터가 주류를 이루는 근본적인 원인은 데이터 과학자와 기술자뿐만 아니라 비즈니스 사용자까지 수용할 수 있는 기능이 제공되기 때문입니다. 그리고 가장 중요한 기능 중 하나는 사람들에게 직접 보여줄 수 있는 비주얼리제이션입니다. 단순히 말로 전달하거나 수치 또는 차트를 보여주는 것이 아니라 사용자들이 차트 및 그래프 시각화로 데이터와 직접 생생하게 상호 작용하는 것입니다.
See what others are doing with Tableau on AWS
Do more with Tableau and AWS products
View customer stories and whitepapers
게시 매체