Viz gallery: Exploring the data stories behind the Rio Summer Games


As the world looks to Rio this summer, we're looking to the data.
To celebrate the Summer Games, we're harnessing the power of the Tableau community to explore the data stories behind the games. To that end, we've put together a gallery of vizzes about the competitions.
Here are a few from our collection to whet your appetite.
How many women compete?
The first-ever games in Greece included no female athletes. Four years later, 22 women (or 2.2% of all athletes) joined the competitions in Paris. That number has steadily grown since, but as of 2012, women still represented less than half of all participating athletes.

Which cities have applied to host?
Rio won the bid on the fourth try, but other cities haven't been so lucky. Detroit has applied seven times and is still awaiting its turn. Los Angeles, on the other hand, has hosted twice, both times after entering the lone bid.

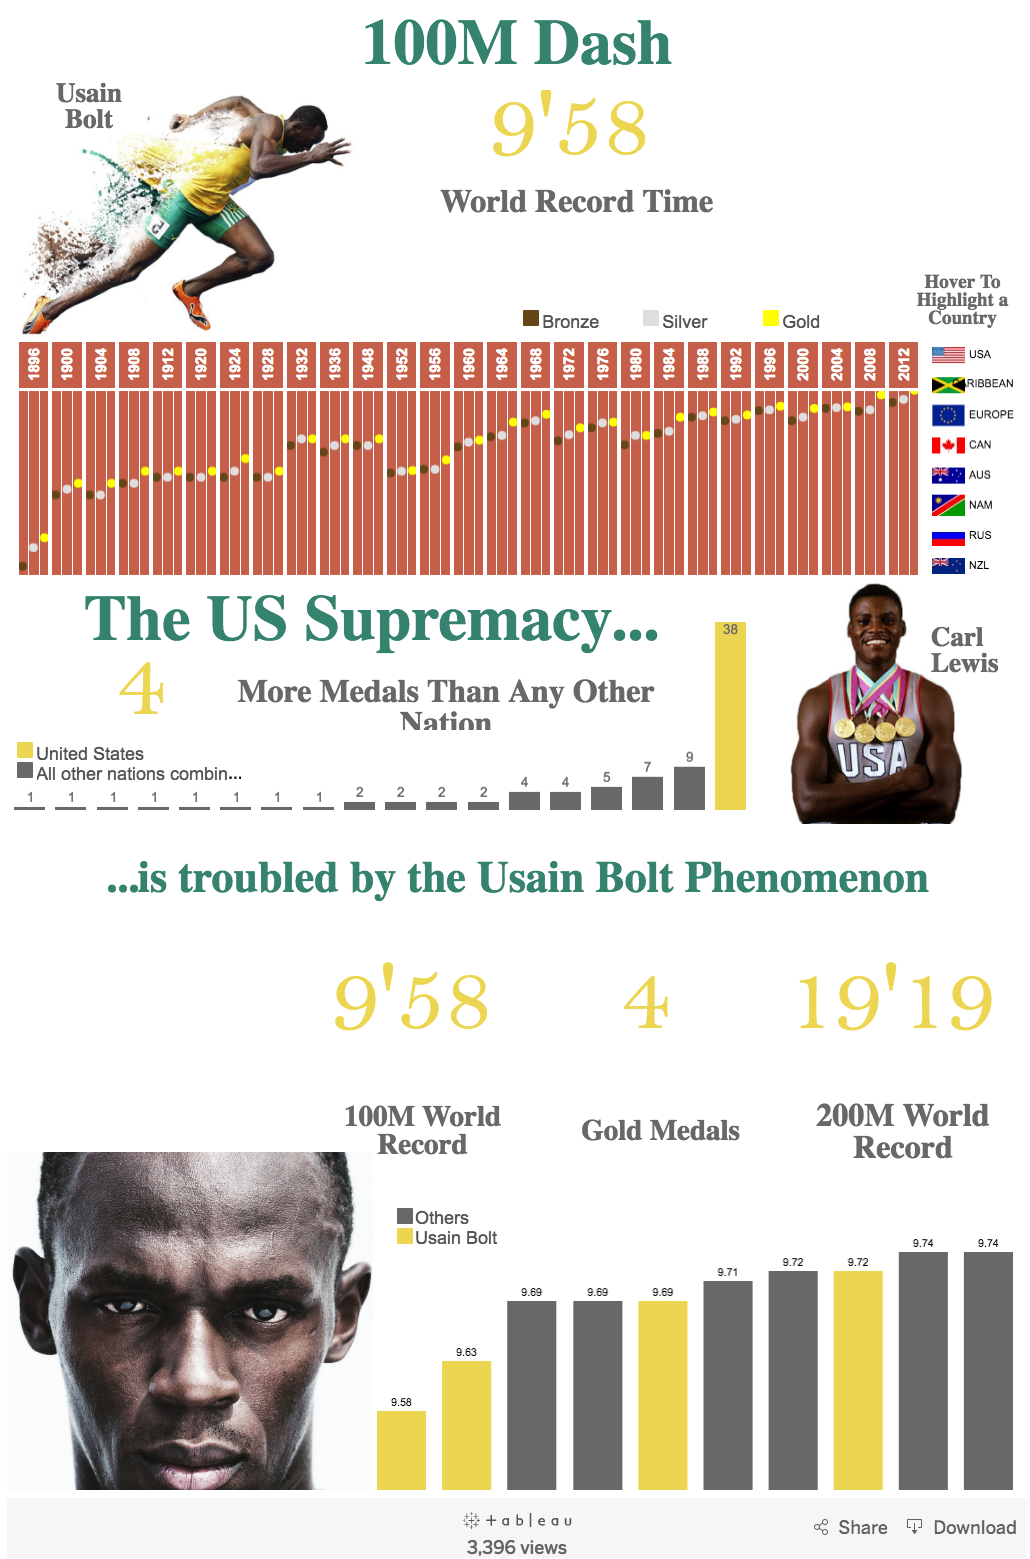
Can the US withstand the Usain Bolt phenomenon?
Americans have historically dominated the 100-meter race, winning four times the number of medals won by all other countries combined. But Jamaican sprinter Usain Bolt will give the US a run for its money, says viz author Adrien Charles.
Join us as we explore the stories, and do check back as we'll continue to update our collection throughout the games. And if you've got a viz of your own, tweet it to us @tableau!
관련 스토리

Visualizing Women's Impact to History Through Data Visualization
 2024/03/18

Behind the Viz: Adrian Zinovei Helps You Design Your Next Dashboard
2024/03/01

Charting the Heart: Data Visualizations on Love
 2024/02/14
Subscribe to our blog
받은 편지함에서 최신 Tableau 업데이트를 받으십시오.