How to create density maps using hexbins in Tableau


Note: This is a guest post by Tableau enthusiast Matt Chambers.
Density maps are a great way to show concentration in an area. I recently saw a density map that visualized the concentration of tornados across the US without representing entire states.
I really liked this approach, and thinking through the steps, it occurred to me that this is dead simple to do in Tableau.
Let me show you how to create a density map in Tableau. Then we'll take it a step further to use hexbins as part of our density map.
How to make density maps
All you really need to do is round the latitude and longitude.
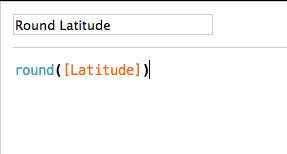
1. Create calculated fields for the rounded latitude and longitude.
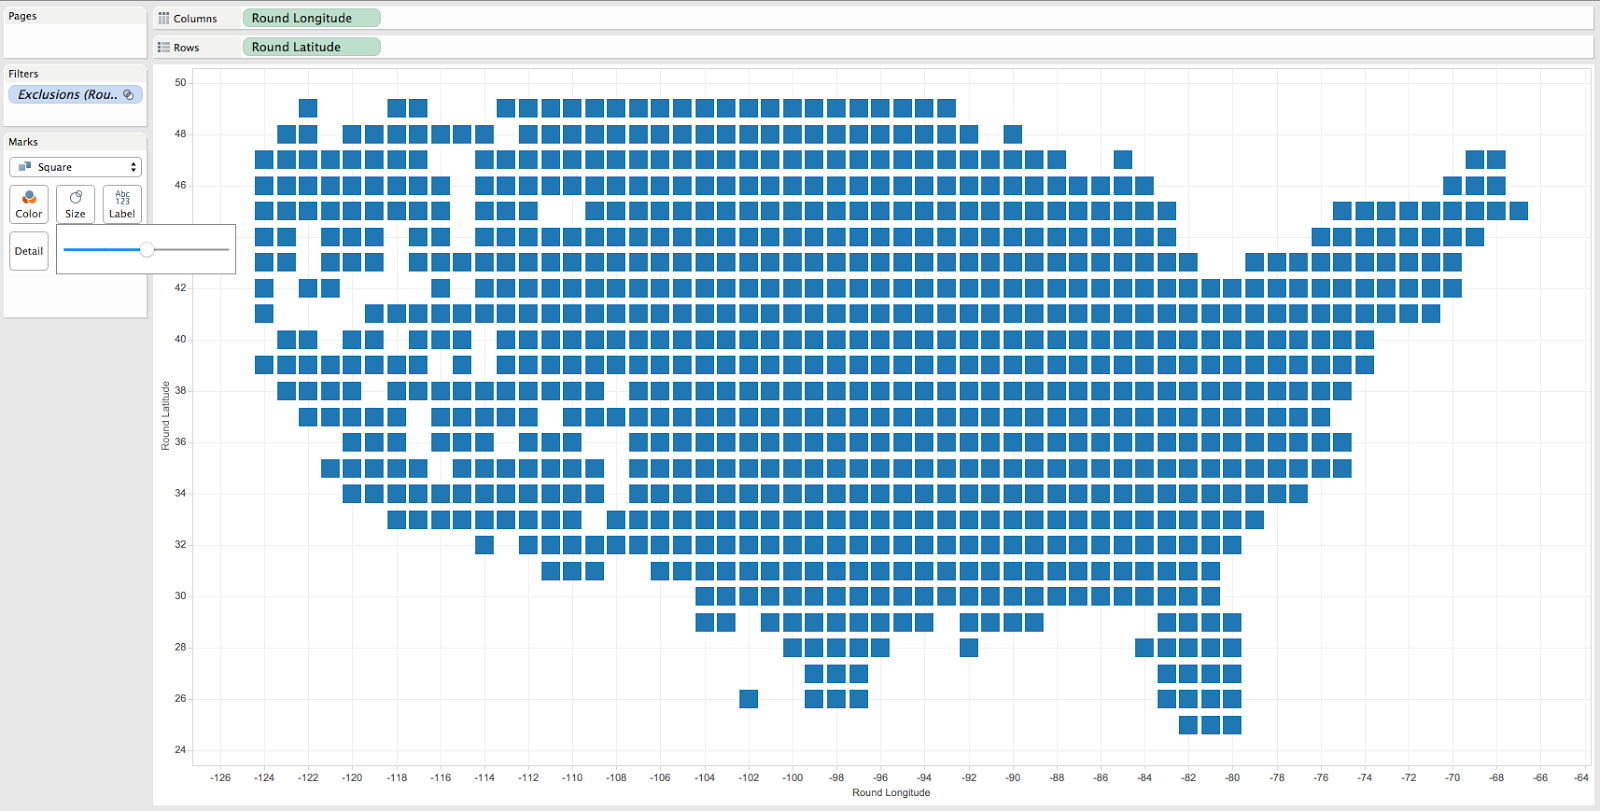
2. Drag the rounded latitude and longitude on to the Rows and Columns shelves. Make sure that both are continuous dimensions. Set the mark to square and set the size in the middle.
3. Drag the dimension you need to the color shelf and turn off gridlines. Hide both headers as well.
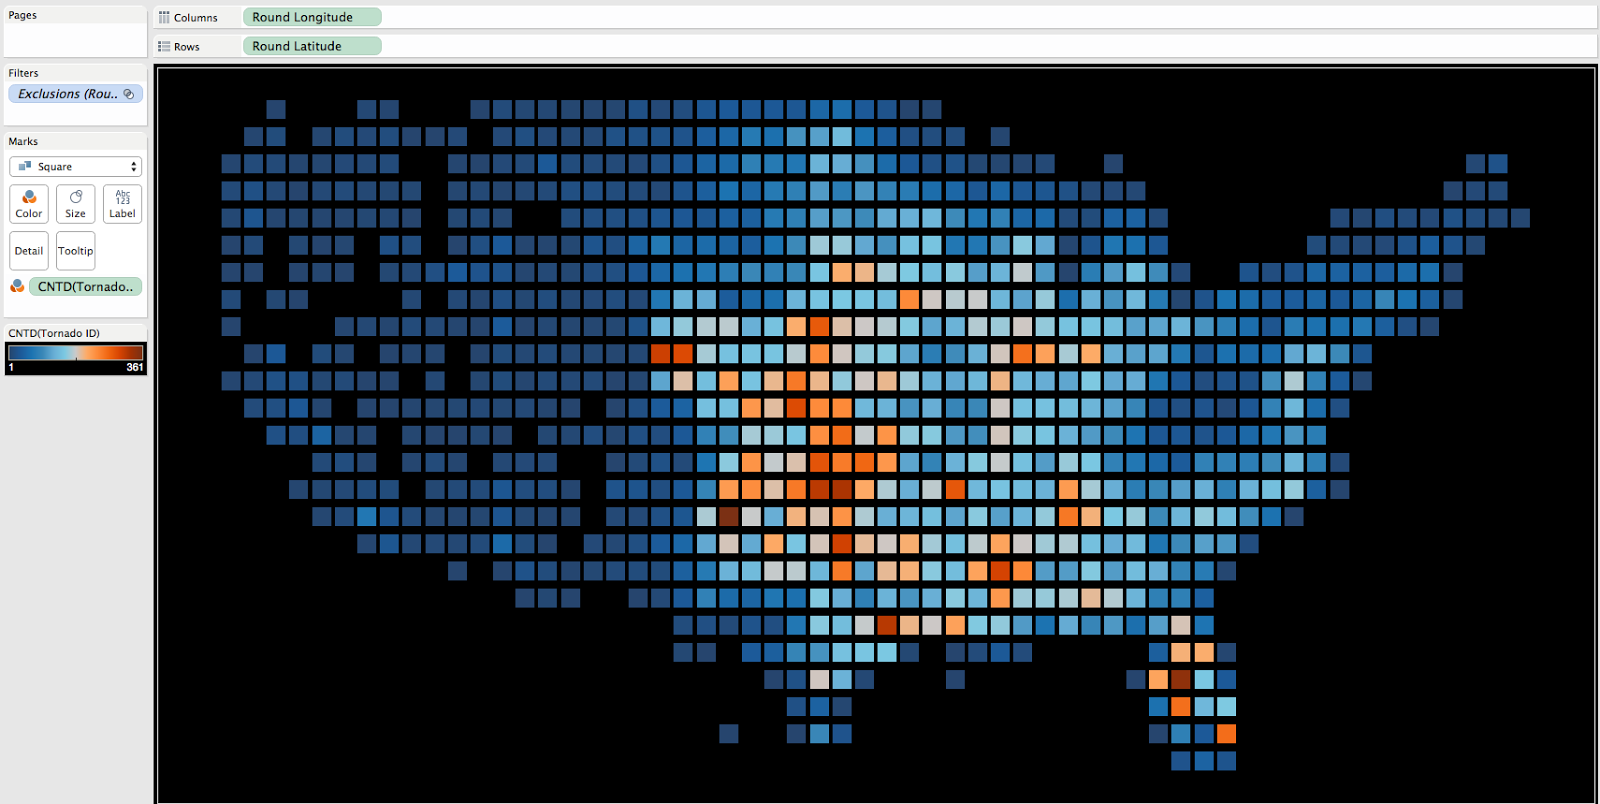
4. Finally, bring the worksheet into the dashboard and size appropriately. I used 1050 by 550 to get the sizing I liked.
And that's it! You can download the workbook here.

How to make density maps using hexbins
Now let’s try using hexbins for our density map. This is a bit more complex than rounding the lat/long but not much. Let's see how it's done.
1. Create a parameter called "ratio." This will let you control the binning. The higher the ratio, the more bins in the view.
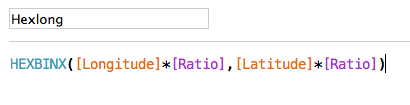
2. Create the hexbins for latitude and longitude.
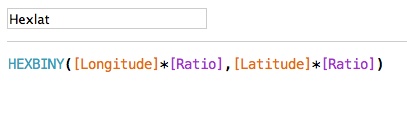
3. Drag Hexlong and Hexlat to Columns and Rows, respectively. Set your ratio to the binning level that you prefer. In this case, I used 2.5. Hide the headers as well.
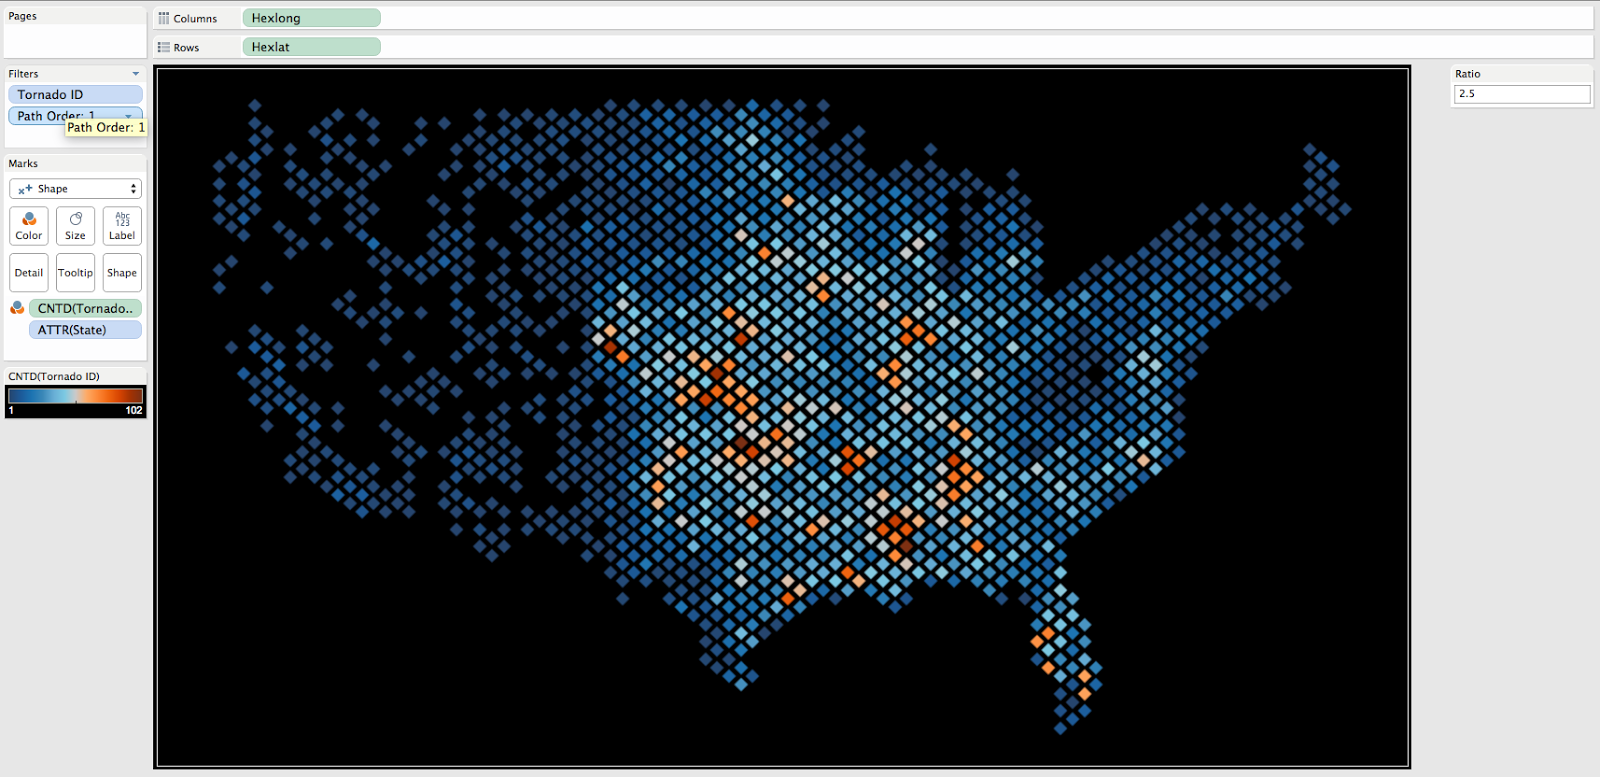
4. Pull the worksheet into the dashboard and size appropriately. I used 1184 by 660 in this view.
That's all there is to it! Feel free to download the workbook and see how it is done. You can also post your questions in the comments below.
For more tips, ideas, and vizzes by Matt, check out his Tableau Public profile page and his blog, Sir Viz-a-Lot. You can also connect with him on Twitter @sirvizalot.
관련 스토리

Visualizing Women's Impact to History Through Data Visualization
 2024/03/18

Behind the Viz: Adrian Zinovei Helps You Design Your Next Dashboard
2024/03/01

Charting the Heart: Data Visualizations on Love
 2024/02/14
Subscribe to our blog
받은 편지함에서 최신 Tableau 업데이트를 받으십시오.