Viz the Makeover Monday challenge!


Hone your data-viz skills by joining the two Andys for #MakeoverMonday!
Our own Andy Cotgreave and Tableau Zen Master Andy Kriebel are leading the weekly exercise. Their goal is to encourage people to cast a critical eye over the charts they see.
“If they see something they don’t like, what can they do, quickly, to change and improve the chart?” says Andy C. “Remaking charts needs to be fast and easy, even when adding deeper analytical depth.”
How to participate
Every Sunday, Andy K. will share the week’s chart and data set on his blog, VizWiz. Then it’s up to you to recreate that chart as you see fit.
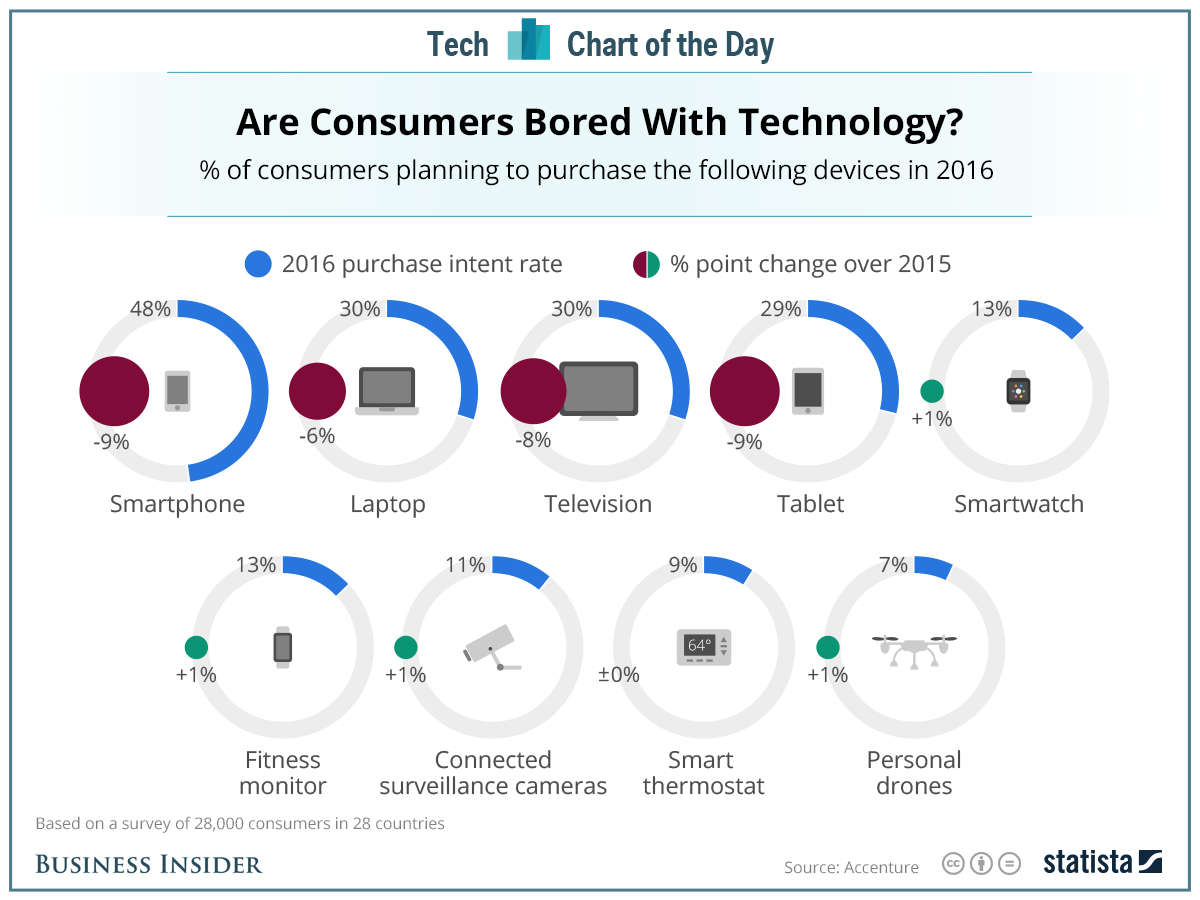
This week's topic comes from a Business Insider chart that asks: Are consumers bored with technology? The data set lists the percentage of consumers planning to purchase each type of devices this year.
Once you've made your own viz, do share your work on Twitter using the hashtag #MakeoverMonday.
Here are a few house rules from Andy K.:
- This is not about criticizing the original authors. They are people like you and me, and they have feelings. Focus on the data, the charts, and the story.
- Focus on what works, what doesn't work, why those things don't work, and how you made it better.
- Consider time-boxing yourself to one hour. Just make something quick.
- The purpose of the makeover is to improve on the original visualisation. Ideally, you should stick to the fields used in the original data set and improve upon it.
Some inspiration
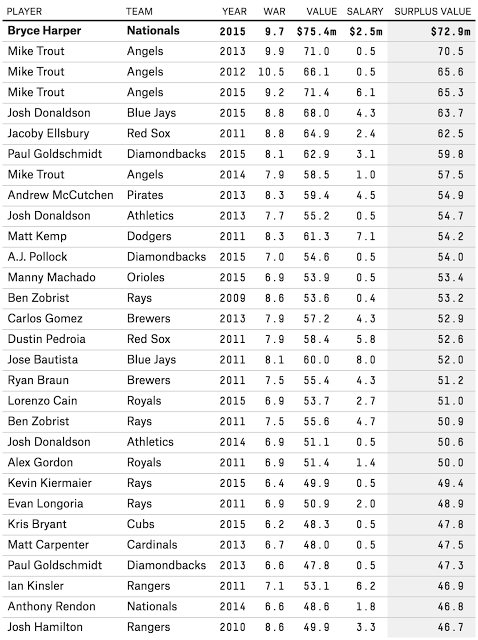
Here are a few examples to get your ideas flowing. A past challenge involved this table from FiveThirtyEight. It lists top MLB players, their salaries, and their estimated value based on performance.
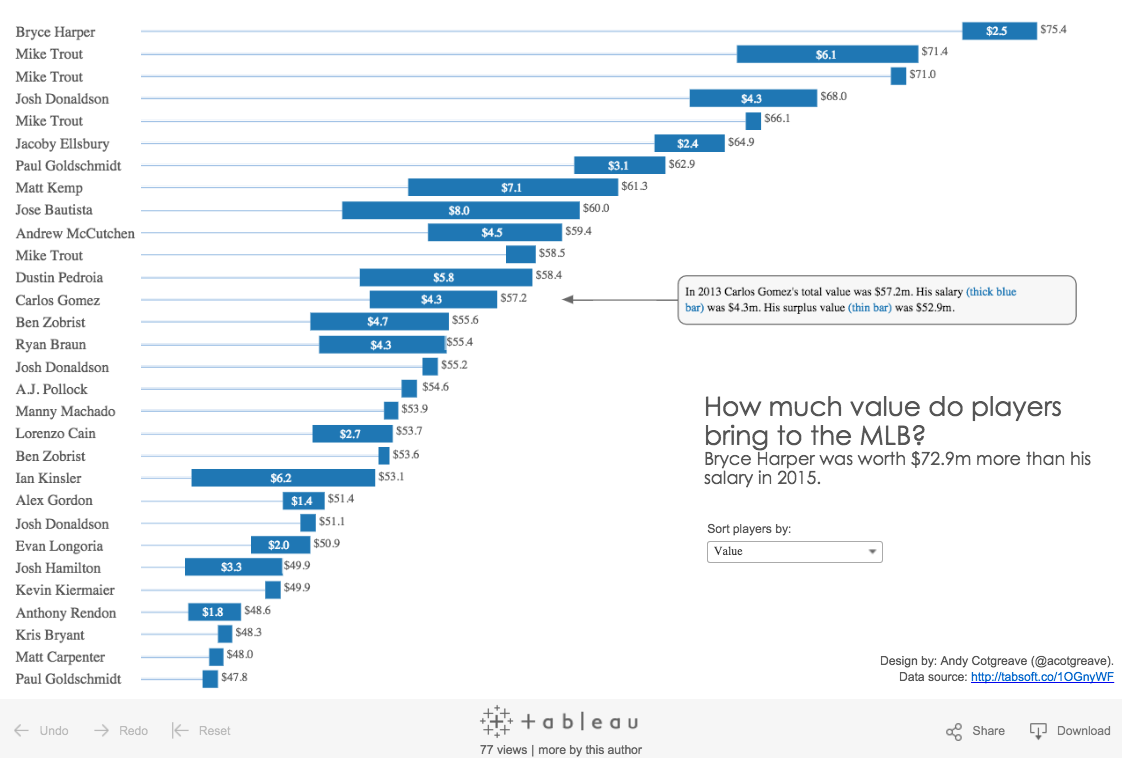
Andy K. took the table and visualized it this way:

And Andy C. came up with this viz:

Here are a few more examples from the community:
Can anyone play #MakeoverMonday ?
I’m keep it simple with a Stacked Bar Chart pic.twitter.com/OompjanSqs
— A R Fox (@The_Foxes_Den) January 4, 2016
#MakeoverMonday @VizWizBI @acotgreave More McCandless than Few.
https://t.co/bnkS2rZLv5 pic.twitter.com/BxsS0GZG0n
— Rob Radburn (@robradburn) January 4, 2016
My shot at @tableau #MakeoverMonday @acotgreave @VizWizBI https://t.co/6VX7dJav36 pic.twitter.com/kYlJrR5Cdn
— Matt Chambers (@sirvizalot) January 4, 2016
Seeing all the different approaches is part of the fun, says Andy C.
“Each week I’m amazed at how many different approaches are taken by people who participate,” he says. “I’m looking forward to seeing this project grow throughout they year as more people participate.”
So dive in, get vizzing, and share what you come up with!
관련 스토리

Meet Iron Viz 2024 Finalist Jessica Moon
 2024/04/15

DataFam Roundup: April 8–12, 2024
 2024/04/12

Meet Iron Viz 2024 Finalist Pata Gogová
2024/04/08
Subscribe to our blog
받은 편지함에서 최신 Tableau 업데이트를 받으십시오.