Data Diaries: How VMware built a community around analytics


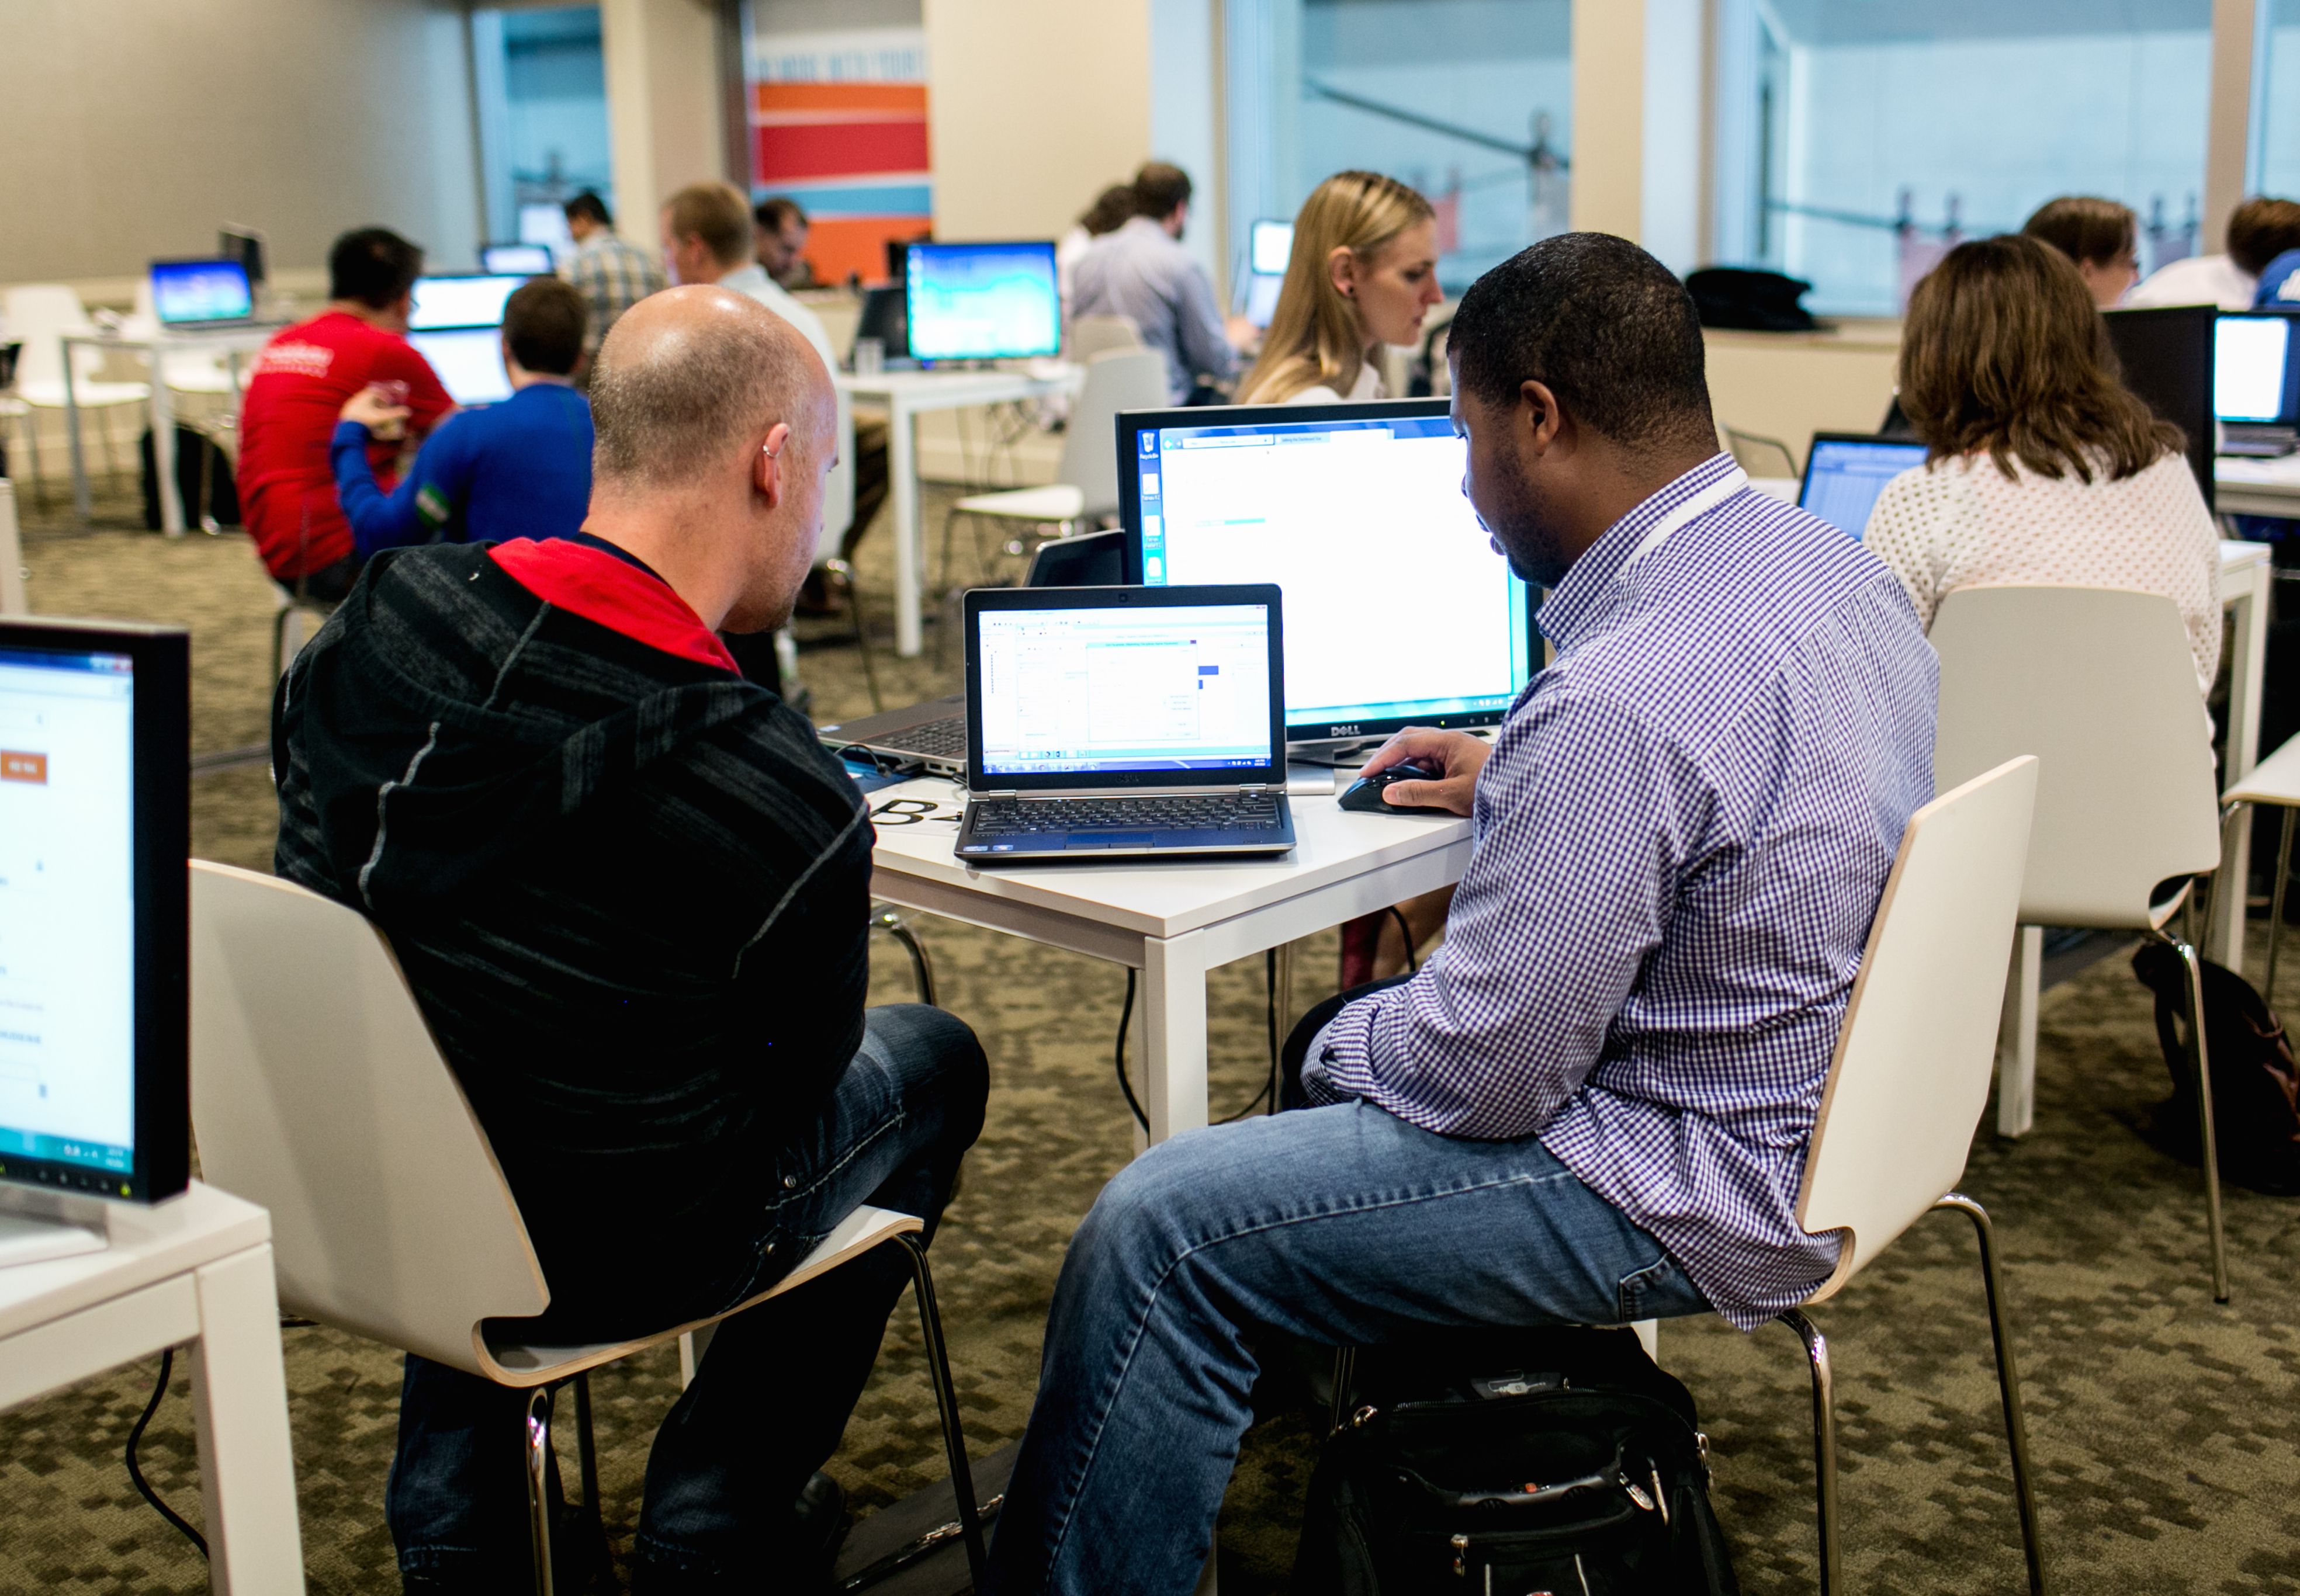
Like VMware, we here at Tableau work to foster a data-driven community. This photo shows people discussing their data at the 2014 Tableau Conference.
Note: Data Diaries is an occasional series that explores the makings of a culture of analytics.
VMware has seen substantial growth over the last five years. This growth produced a need for speed when it came to data analysis. And this need of the business created an information anarchy.
“Everybody was doing things differently in different pockets,” says Ginger Victor, the company’s business intelligence analytics manager.
The disarray posed several problems for the provider of virtualization and cloud-computing software. First, with people unknowingly duplicating efforts, the system proved inefficient. And without any data governance, accuracy was also a concern.
“Our execs were getting different data from different people, different sources. And it became hard to understand what our source of truth was,” Ginger says.
VMware liked that its team members were engaged and asking questions. But it needed to empower people in an accurate and scalable way. And it wanted to help align efforts through centrally-managed tools and information while also allowing them to exercise individual creativity. The company found its answer in a culture of self-service analytics.
Defining a culture of self-service analytics
Here at Tableau, we define a culture of self-service analytics as one in which data plays a central role in every major conversation. Everyone has the ability to ask and answer questions of their data. The entire organization subscribes to a data-backed truth, and facts drive decisions.
At VMware, this culture meant different things to different people. For the sales team, which has a group of power users, it meant having direct access to the enterprise data warehouse. For the analysts, it meant determining their own analysis—what to measure, and how to consume it. And for the executives and the business users, it meant changing views on a dashboard that someone else built for them.
Fostering change from the top down and the bottom up
VMware’s journey toward this culture began with a vision: “The biggest thing that we wanted to do was try to build a community,” says Ginger.
The goal was clear from the start. It wasn’t to simply implement sweeping changes, but to empower employees to understand data and encourage participation.
“The big thing we’ve done from a values perspective is that sometimes the Center of Excellence-type of communities can be taken as like, ‘hey, they’re taking over the world,’ or, ‘they’re telling us what to do,”’ says Ginger. “So the value that we’ve been trying to bring is that empowerment of the community where they really feel like they’re part of it, and taking them along for the ride.”
As its first step, the analytics team gathered its data and checked for accuracy. Then the team shared certified data sets with the entire organization. This approach ensured consistency and accuracy across the board.
The team also gathered all of VMware’s analytics solutions in one portal. These tools—which included resources and a catalog of all available dashboards—“allow people to see, end to end, what BI is all about,” says Ginger.
Ginger and her team worked from the top down and the bottom up to foster culture change. First, the team worked with executives to streamline how they were consuming data.
“That really sparked, I think more than anything, the change,” says Ginger. “The executives are now becoming sponsors, saying, ‘Hey, business intelligence is important, and by the way, this is the way we should start consuming our data.’”
The executives shared their dashboards and helped systemize data sources. Their message was: “If you guys send me anything, it should align with what I’m looking at here,” says Ginger.
For the bottoms-up approach, the team asked internal speakers to share their uses cases and help prove out the value of an analytical culture. The team chose this approach with its goal of community building in mind.
“We wanted to instill the value of what we’re trying to drive, so we had speakers from across VMware talk about what they’ve been doing with data visualization, talk about the impact on the business, and how they’ve been able to change the way they make decisions,” Ginger says.
The team also launched a weekly nurturing program, called Tableau Power Hour, to offer one-on-one help. And VMware recently hosted its first Visualization Day, a full day of sharing ideas.
What resulted from implementing this culture
VMWare has made big strides since it began its journey toward a culture of self-service analytics, says Ginger. Most importantly, the company now has a vibrant community built around data analysis. More than 400 members are part of its online forum dedicated to business intelligence.
“They jump in, ask questions. And we’re not always the ones who have to respond. The business is helping the business,” says Ginger.
And now that people have the ability to uncover insights themselves, they’re excited to participate.
“Something’s lit up in people. It’s about trying to find the gem that nobody’s found before, and really analyzing the business in a new way and being able to track progress,” says Ginger, seen below.
Why this culture makes people happier
Seeing and understanding our data satisfies our innate curiosity. We want and need to know why something is; we’re not convinced without understanding the why.
That’s why seeing a static chart during the last sprint of a project doesn’t give us the same satisfaction as analyzing the data throughout the process. As we track progress and make informed decisions, we relish the intrinsic reward and become emotionally engaged.
Tasks that offer immediate feedback and clear indicators of progress help us enter a state of flow. We toss aside our worries about failure and challenge ourselves to grow. And we find progress incredibly satisfying.
A culture of analytics helps us frequent this blissful and productive state. There, we can aspire to think beyond ourselves and connect to a purpose larger than ourselves. We become happier, more productive, and more results-driven. We help drive more cohesive teams and, ultimately, a more effective organization.
To learn more about VMware's culture of analytics, check out our webinar.
Learn more about building a culture of self-service analytics
Data Diaries: Defining a Culture of Self-Service Analytics
Building a Culture of Self-Service Analytics? Start with Data Sources
In a Culture of Self-Service Analytics, Enablement Is Crucial
Boost Your Culture of Self-Service Analytics with One-on-One Support
Going to Tableau Conference? Attend our sessions on building a culture of self-service analytics. Hear from Tableau users implementing this culture at their organizations. Learn about Tableau Launchpad as well as Tableau's own enablement platform.
관련 스토리

Embedded Analytics: Should you build or buy?
 2022/06/07

IT’s role in building a Data Culture: Analytics agility, proficiency, and community
 2021/12/06
Three ways to help everyone make fast, data-driven decisions with modern BI
2021/11/22
Subscribe to our blog
받은 편지함에서 최신 Tableau 업데이트를 받으십시오.