Lessons from photography: How to better visualize data


Note: The following is a guest post by Tableau Zen Master Yvan Fornes.
Ever since I began traveling by myself at 16, I’ve loved taking pictures. In the beginning, it was only to remember the places liked, the people I met. But little by little, it became a way to express myself.
When we had our two sons, I started taking pictures to capture everyday life. As I began taking more photos, I wanted to understand: Why did I like some pictures more than others? Why did I feel moved by some but not others?
I bought books and started following a few blogs, including the one by Anne Laure Jacquart, a French photographer. She knows how to reveal the beauty and the poesy of simple things that surround us in our normal life.
Photography and analytics: Combining two passions with Tableau
When I discovered Tableau at work, it was like the day I got my first digital camera. I had finally found a tool with which I could answer my customers’ questions faster than ever before! And I could also apply my passion for photography when designing dashboards.
In fact, there are a number of data-viz lessons we can learn from photography, my first passion.
1. Shoot and viz with intent
Too often, when we talk about photography, we focus on the camera type, the model, the number of pixels, and so on. But the camera is not that important.
The most important is the message we want to convey. Everything else—the picture frame, the shutter speed, the depth of field—will derive from the intent.
For example, when I made this photo, I wanted to show how the powder snow was bountiful and how small we were compared to the mountain. So I chose to show just snow in two-thirds of the picture. And I waited for skiers to pass at a distance so that I could capture them as small subjects.
As the snow was my main subject, I focused on the powder and adjusted the iris to get a good amount of light on the snow (the iris was almost closed as the sun was beaming straight into the lens).

Likewise, in order to capture attention and be useful, a viz must have a clear intent. When I visualize data using Tableau, I force myself to set a clear question or hypothesis before digging into the data or even before looking for the data.
For example, earlier this summer, it took me a few days to find a question that would have a social dimension as well as a sport-related angle: Are Paralympics encouraged by the main Olympics countries?
As I wanted to convince people that the Paralympics should be considered as important as the Olympics, I chose to use a newspaper layout to add a serious tone. For the same reason, I chose to use only two colors. Then I chose two KPIs that would allow me to compare each country performances in both Games. The KPIs, the layout, and the data that I used all derived from the question I wanted to answer:
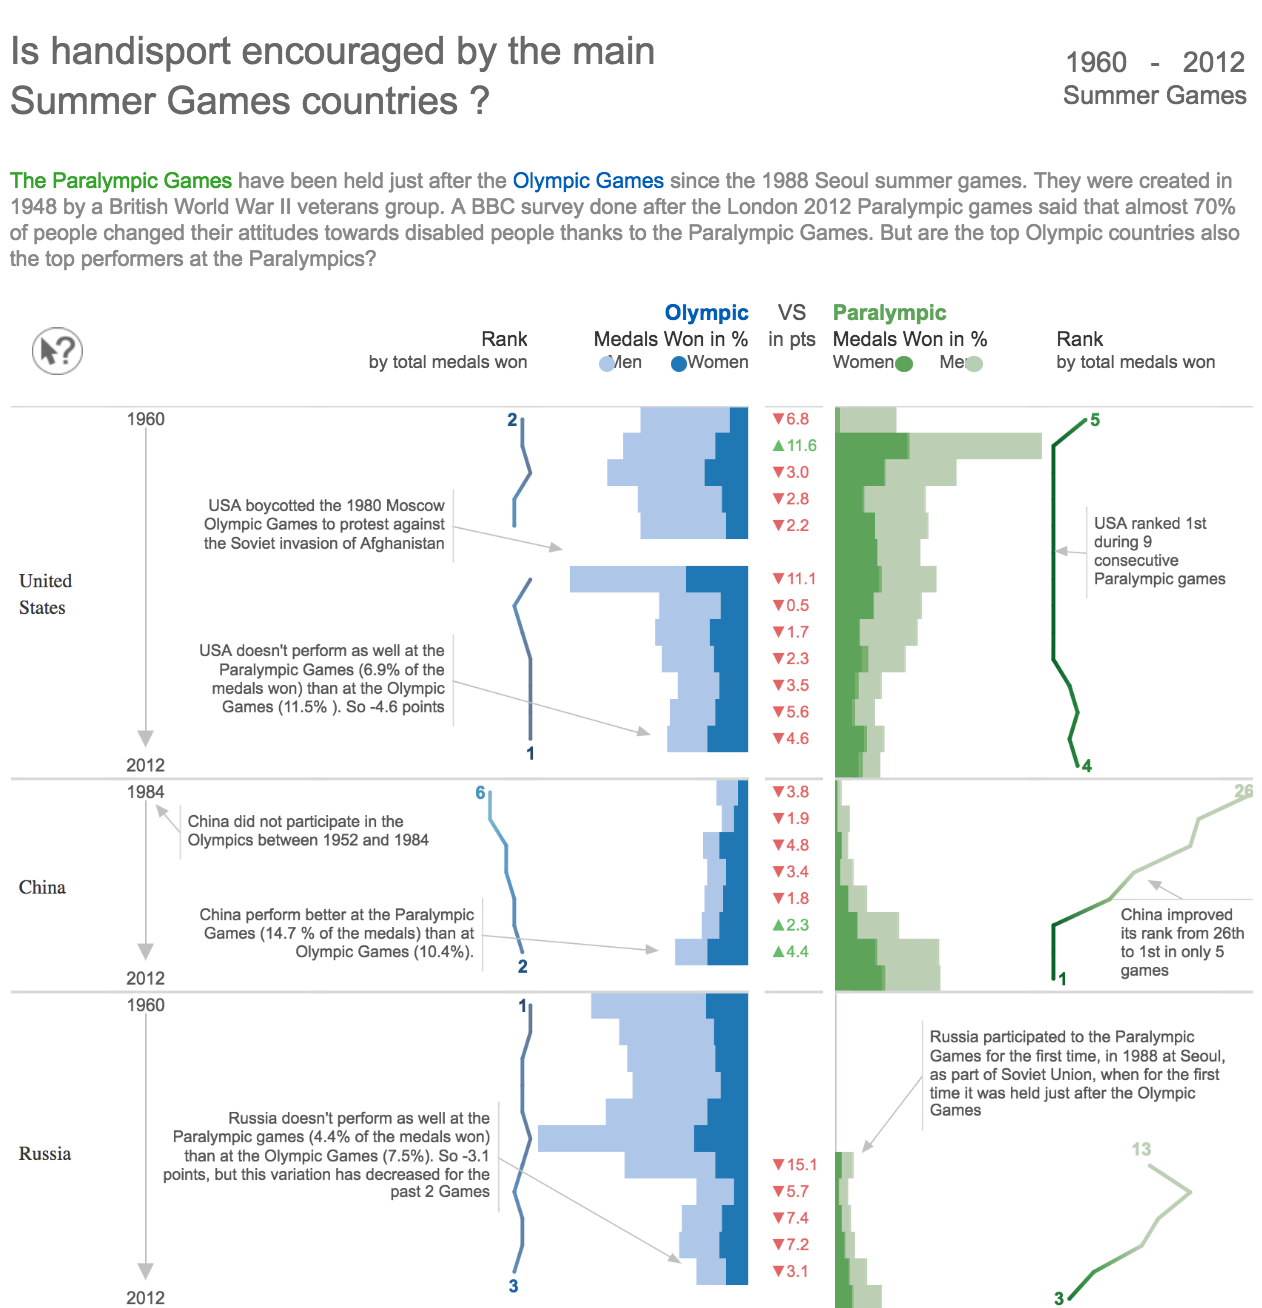
Click to see the full viz.
2. Choose a background that highlights your subject or sets the stage
There are many tools we can use to highlight our main subject when composing a picture: the size, the contrast, the colors. There is one more key element—the one that I did not pay attention to when I first started shooting: the background.
When capturing a picture, it is easy to focus its attention on the main subject and forget about the background. Then you could end up with a picture that is too crowded or not simple enough. Or maybe the picture doesn’t convey your message because the background doesn’t highlight the main subject.
The background should be used to contrast with the subject or to set the stage. In this picture, the background was very busy, a fun fair. The solution to have a background that set the stage and kept the picture simple was to use the speed of the carousel to have a blurred background.

In a dashboard, so many things can distract the reader. Anything that is added should have a specific purpose. If it is not helping to answer your question, then it should be discarded. Here’s a quick checklist:
- Do you need grid lines as graph background? Is it helpful in understanding your graph?
- If you’re using a map, do you need a blue sea? Would it be better to use the same color as your background?
- Do you really need that picture in the background of your viz? Is it helping or distracting?
- Do you need more than one font? Is your text too bright compared to your graph?
There are two Tableau Public authors who’ve helped me improve my viz backgrounds, Jonni Walker and Ryan Sleeper.
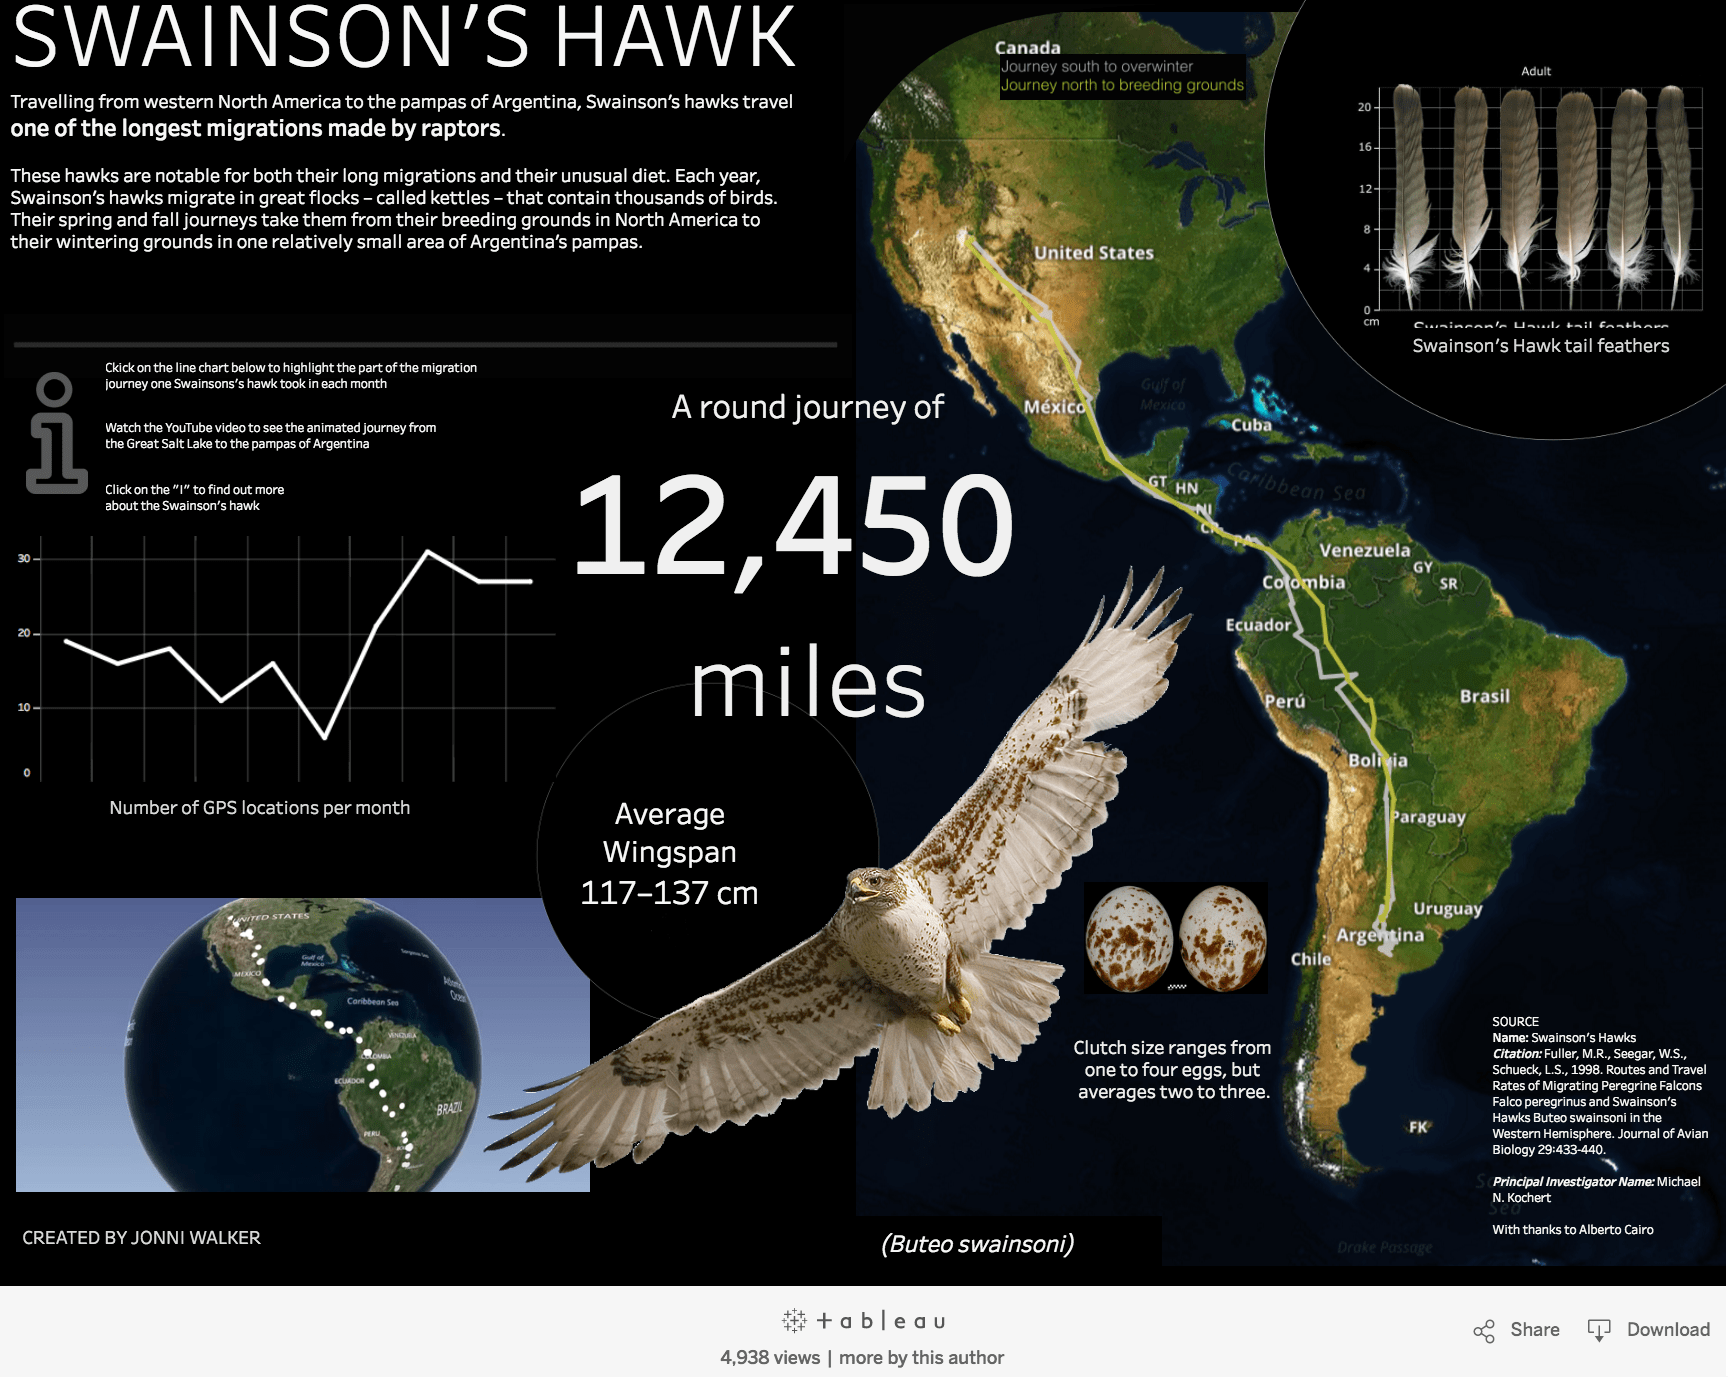
Jonni Walker is a whiz at using the background to both add context and to catch the reader attention without crowding the viz:
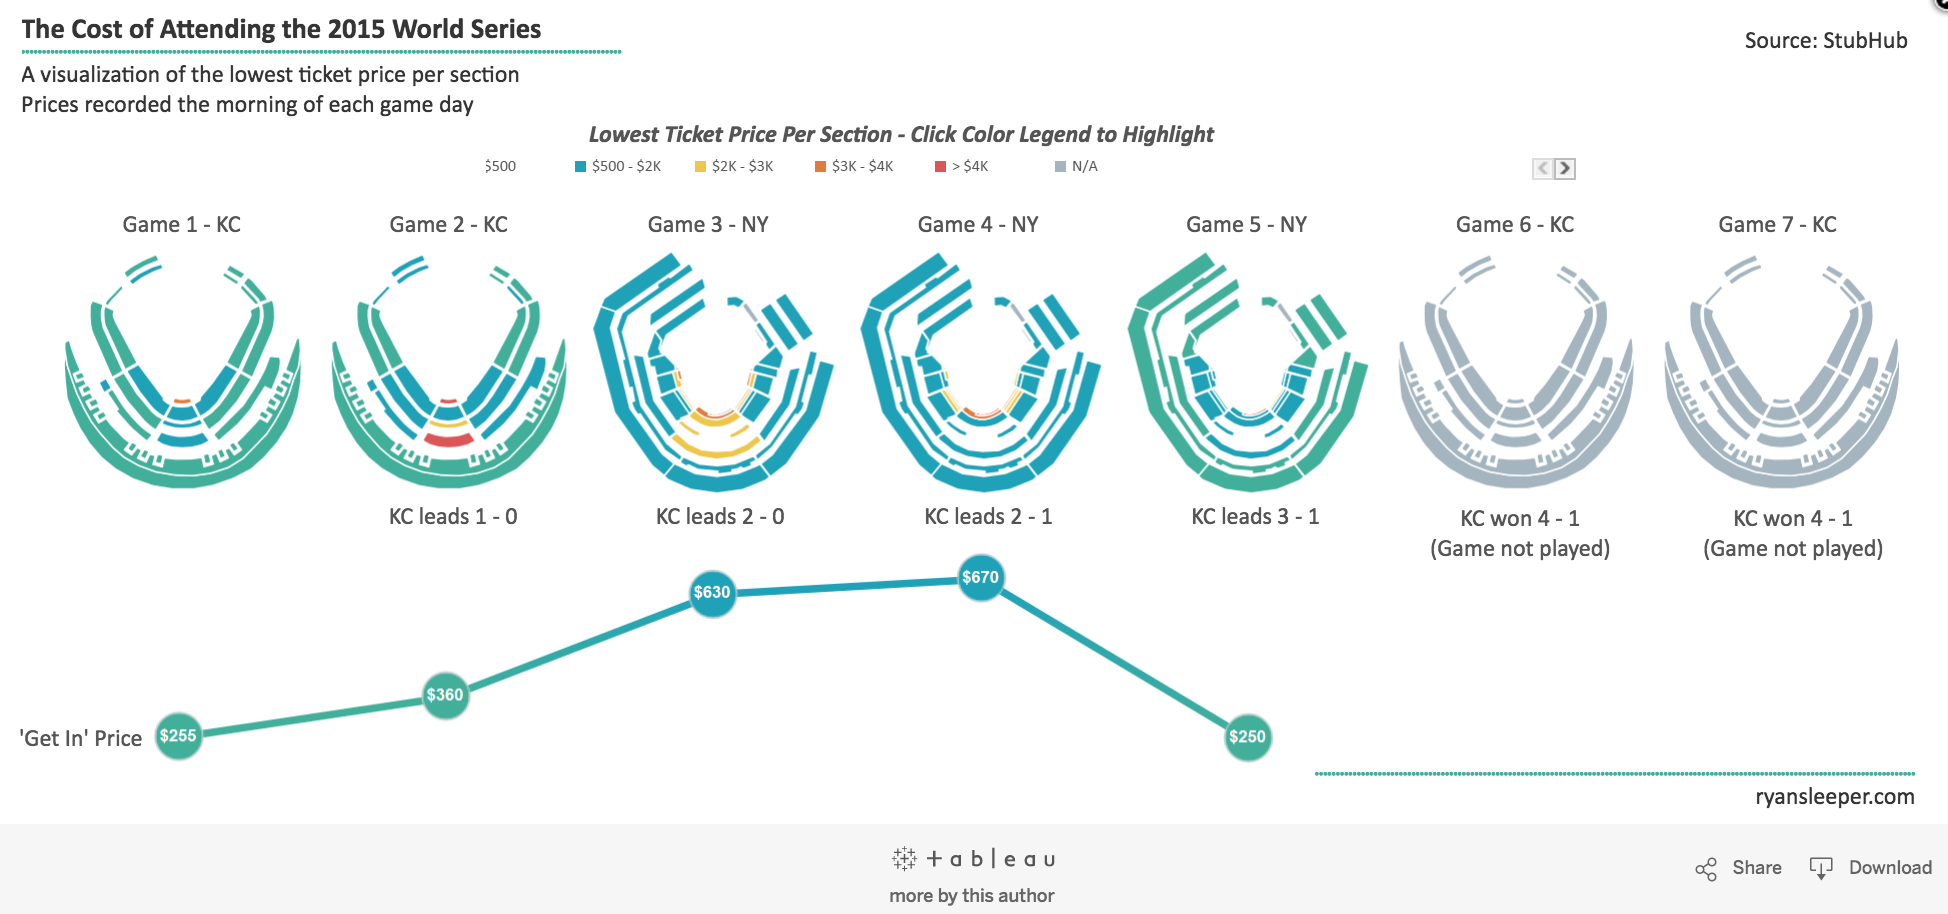
And Ryan Sleeper is an expert at keeping his viz simple. He does not add anything that does not have a purpose.
So whether you’re composing a picture or creating a viz, remember to first set a clear intent, a goal. Then keep it simple. Don’t add a word, a line, a color, a subject to your picture or your viz if it does not serve the intent.
For more tips, tricks, and vizzes by Yvan, check out his Tableau Public page and connect with him on Twitter @YvanFornes.
関連ストーリー

Visualizing Women's Impact to History Through Data Visualization
 2024/03/18

Behind the Viz: Adrian Zinovei Helps You Design Your Next Dashboard
2024/03/01

Charting the Heart: Data Visualizations on Love
 2024/02/14
Subscribe to our blog
Tableau の最新情報をメールでお知らせします