With Location-Based Data, Maps Can Help Tell the Story


Location-based data is packed with insight, but it can be hard to visualize. People are often intimidated by mapping and geocoding, but avoiding maps can restrict the value of location-based data.
Maps are more than just a new layout for your data; they're topical. People make associations with different geographies, so by putting data on a map, you're already telling a story. For example, the Council on Foreign Relations uses a map to measure outbreaks of diseases that could be prevented by vaccines, sparking questions about geographical and political forces at play. Imagine the lesser impact this data would have if it were assembled in a table.
And I'm not the only fan; our community is crazy about maps. Let's take a look at some especially innovative uses of maps in recent times. (Click on an image to view the viz.)
Neil Charles visualized the ups and downs of cross-country paragliding in the UK:

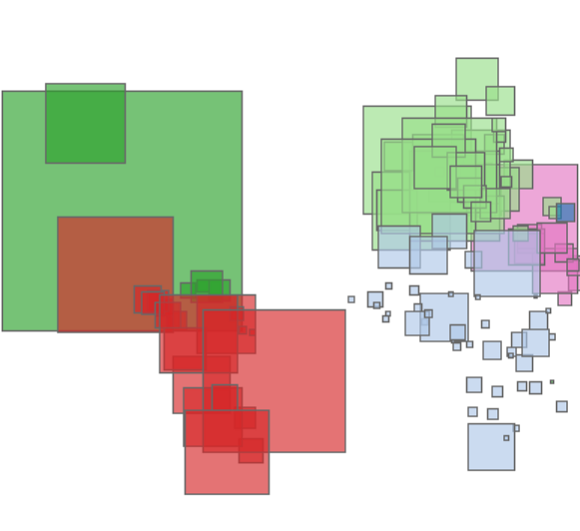
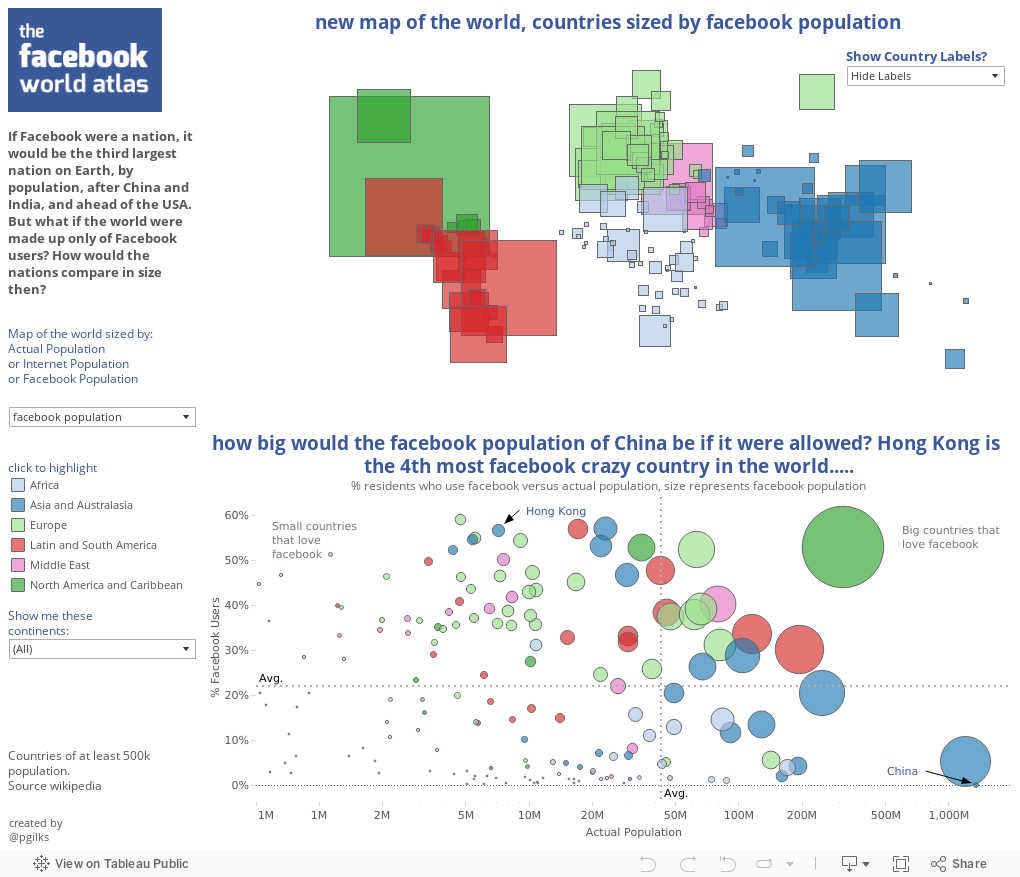
Peter Gilks of Paint by Numbers imagined the world in which size of countries was proportional to Facebook population:
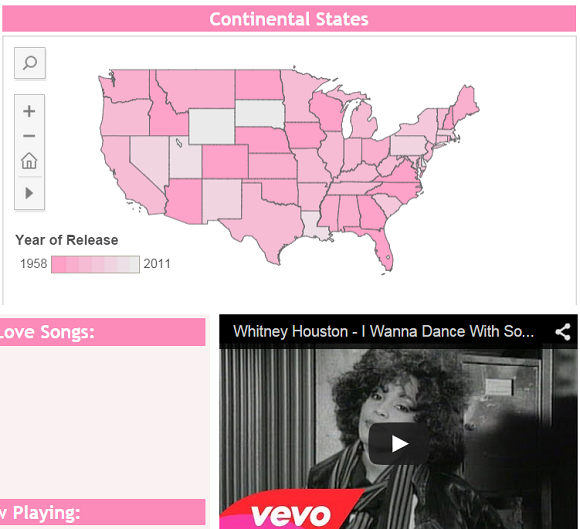
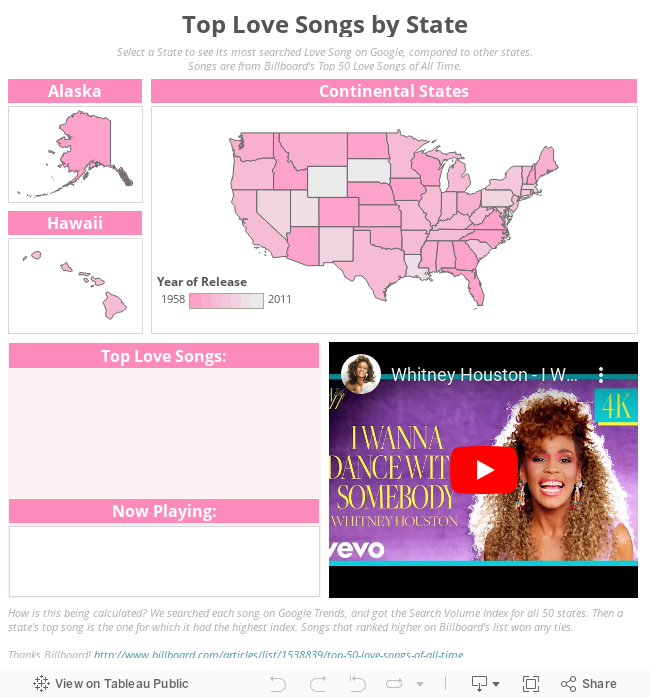
In the spirit of love, Clara Siegel visualized top love songs by U.S. state:
Here are some other great examples of members of our community using maps to tell their stories:
Pretty cool, huh? Since they're so compelling, maps often grace our Viz of the Day feed, which you should follow for more mapping goodness.
Tableau’s mapping feature is intuitive and flexible, and it's packed with cool features. Some of my favorites are mapping multiple variables at once, and implementing maps in dashboards using URL actions. If you're curious about how to get started with maps, check out these resources:
Resources
- Get started using maps in Tableau: Mapping Basics
- Whitepaper: Maps: The Power of "Where"
- Inside the Mind of Tableau's Maps Service Team
- Tableau Maps Service Update: "You Can Call Me Al"
Don't have Tableau? Here's a free trial.
Now go have fun with mapping. There's a world to explore.
Subscribe to our blog
Tableau の最新情報をメールでお知らせします