8.2 Preview: Mapping


Worldwide Data
Our new maps are now powered by OpenStreetMap data, the wikipedia of accurate and up to date locally generated geographic data. We take 50 gigabytes of spatial data, including almost 24,000 cities, 1 million translated place names and synonyms, and over 21 million miles of roads. This all leads to nearly 5 trillion unique tiles, each one customized to your chosen combination of layers and labels. We’ve even started adding more geo data worldwide, including French Departments and Spanish Provincía, as well as county equivalents in the UK.
High Resolution
If you’re on a Mac or any mobile device you’ll see our new high-DPI optimized map tiles with 4 times as many pixels as regular map tiles. To accompany these new tiles we’ve added intermediate zoom levels for a crisper and clearer zoom experience and a sharp map at any scale.
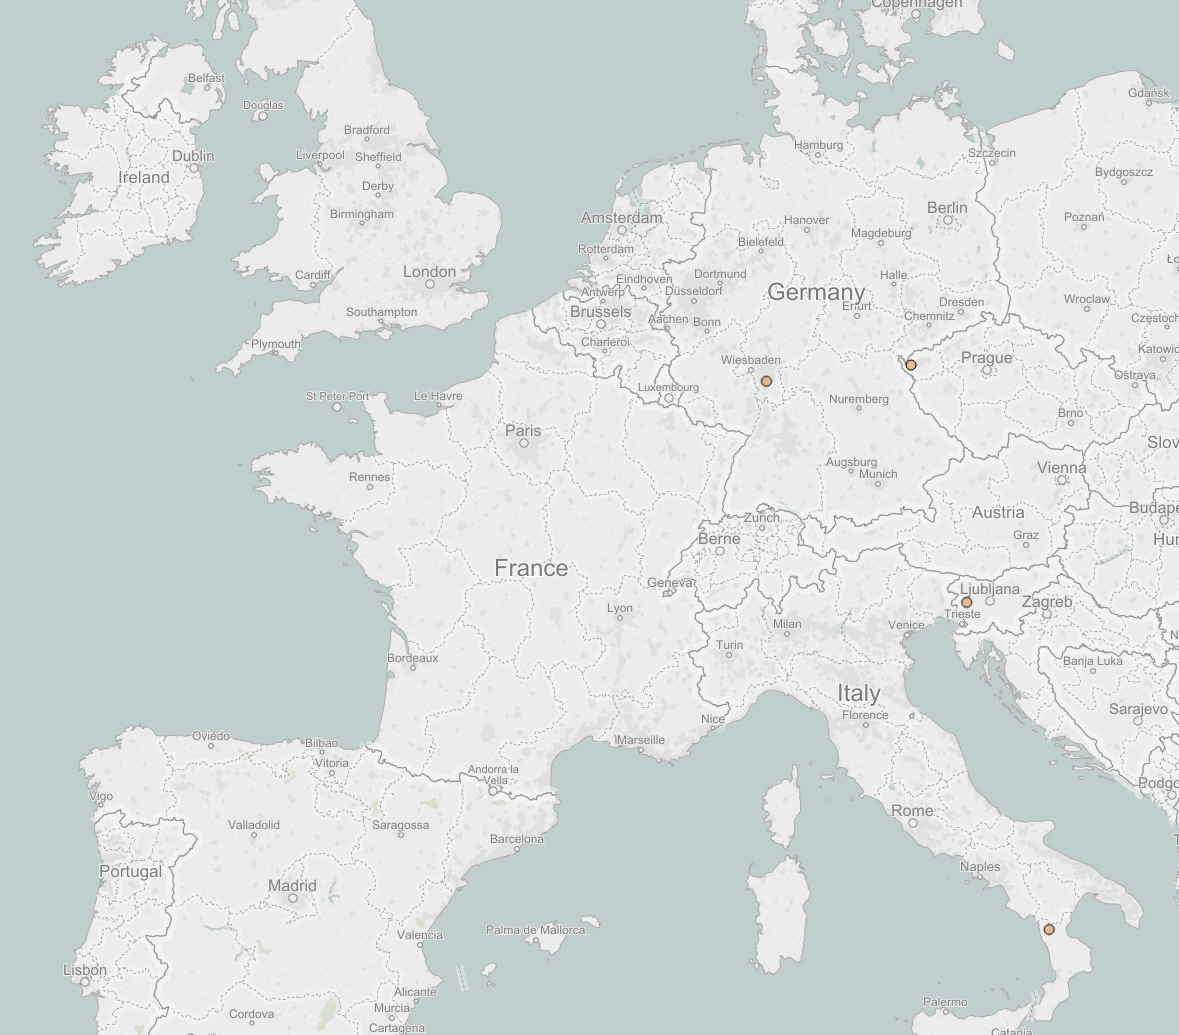
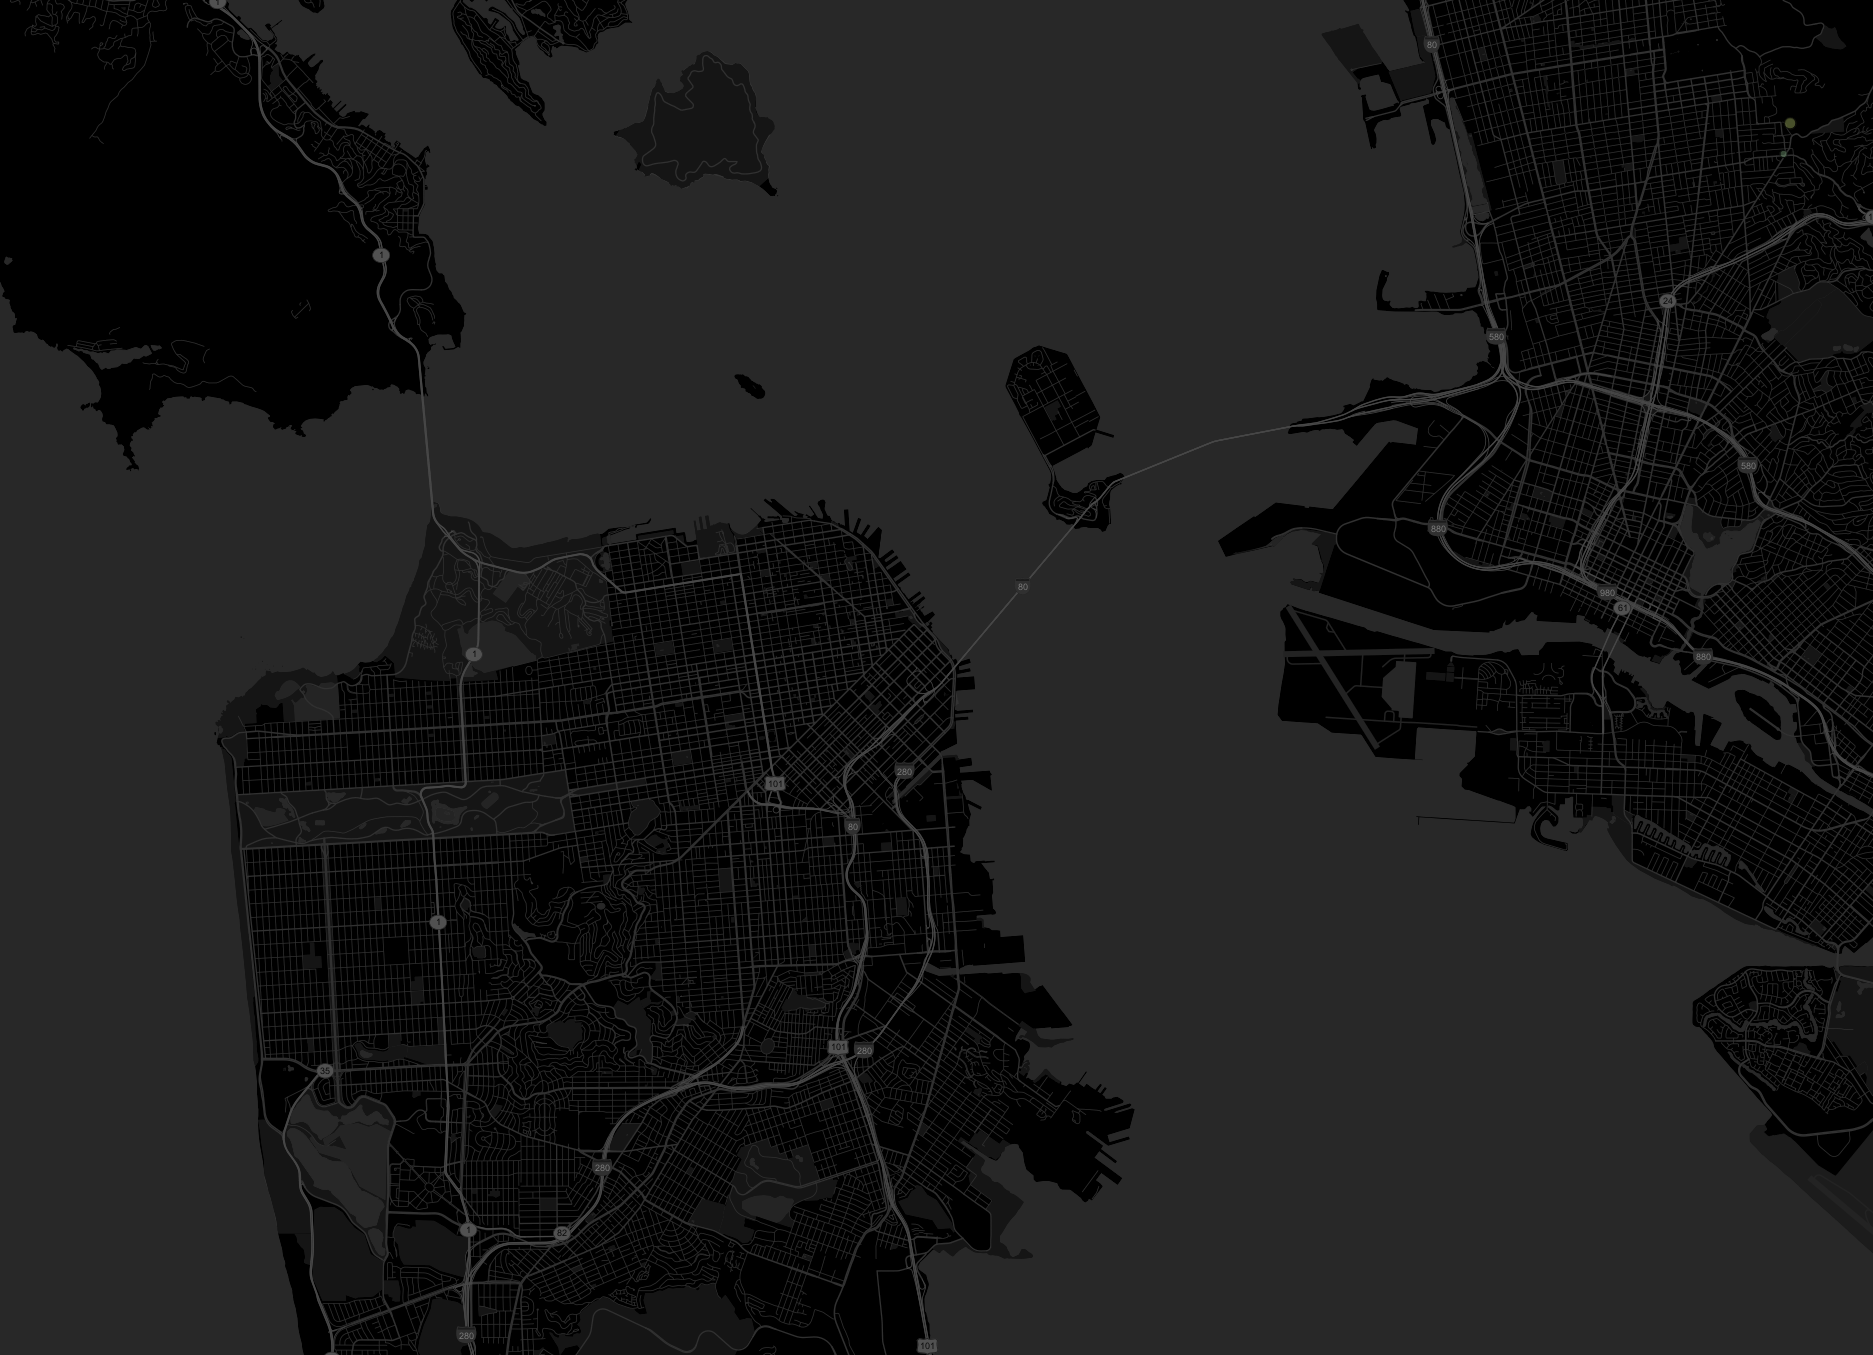
Designed for Clarity
Our in-house mapping team worked very closely with the visualization and mapping geniuses at Stamen Design studio to bring the OSM data to life in visually stunning new map tiles. If you haven't seen their work before, check it out. We re-envisioned our 3 distinct map styles; dark, light, and blue water to make your data much easier to see and understand. All it takes is one look at the new maps and you won’t want to go back to the Tableau classic maps.
Total Ownership
To host these brand new map tiles we’re bringing the entire mapping service in house. We now own the maps and their visual design, and provide them directly to you on servers we manage. This means quicker load times for you, whether you’re designing in Tableau Desktop or viewing on Tableau Server, furthermore, we now have the ability to distribute mapping servers worldwide, providing a consistent experience globally. We can update and add new map content much more frequently than ever before.
Browser Optimized
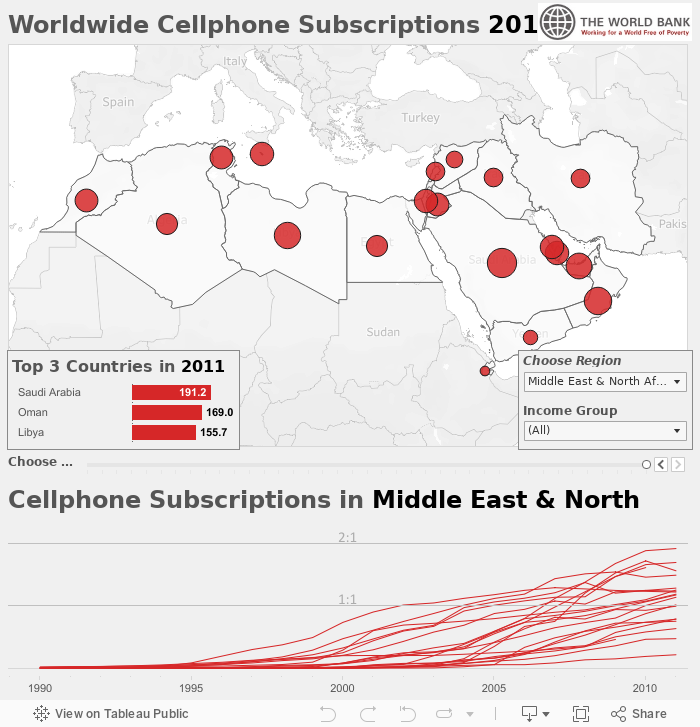
To make drilling down on every device quicker and more responsive we’ve changed how our servers handle mapping requests, tiles stream to you quicker, even as you skip zoom levels and pan around. For anyone familiar with browser-based mapping, we’re integrating with the Leaflet Javascript library to provide a smoother browser experience. Instead of rendering the entire map image for you on Tableau Server, we instead send the individual map tiles directly to your browser to use as needed. We've also added much more responsive marks, hover over the countries in the viz below to see how quickly they light up.
More Mapping Choices
All your old workbooks will continue to use the classic maps style, this means the same look and feel as when they were first uploaded. If you do want to switch to the new maps, just re-save your workbooks after choosing the new background maps under the map options menu.
Your Maps
Let us know what you think of the new map updates, we’re always looking for ways to make the experience better for you. If you have any maps you want to share reach out to us at social@tableausofware.com
Subscribe to our blog
Tableau の最新情報をメールでお知らせします