New Tableau for Teaching curriculum modules now available


Here at Tableau, seeing and understanding data costs nothing for students. Full-time students get a free one-year license of Tableau Desktop through Tableau for Students. And instructors can get a free one-year license and student licenses should they decide to use Tableau in the classroom.
We offer these academic programs because as the amount of data increases, so does the need for data literacy in the workplace. These programs aim to make learning these skills as easy and accessible as possible.
But what about teaching material? Teachers, we’ve got you covered. We partnered with Michael Galbreth, associate professor of management science at the University of South Carolina, to develop a modularized set of resources. These include lecture notes, student handouts, assignments, and exams.
With these resources, you can create a Tableau sequence that makes sense for your students. You can also customize the plan to fit the amount of time you dedicate to Tableau in your course. You can choose to stick with the basics, or add advanced topics like social media data, sustainability and non-profit applications, advanced mapping, and many others.
Here’s an example of an instructor script from the charts module, under advanced topics.
Example: A lesson on market basket analysis
This class demonstration provides a detailed walk-through of how to create a market basket analysis in Tableau. Students are encouraged to follow along and/or take notes on the provided student handout. This topic uses the global superstore data set, which ships with Tableau.
To accomplish this in Tableau you need to join the data set to itself, i.e. a self-join. Since global superstore is an Excel file, we need to use the legacy connection because Tableau’s new connection approach doesn’t support self-joins for Excel.
1. Open Tableau, select Excel file, navigate to global superstore, and click the drop-down next to Open and select “open with legacy connection.”
2. In the data connection window, create a self-join by dragging out the orders table
3. Choose inner join.
4. For the join clause, use both of the following:
- customer ID = customer ID: This is the level of detail for the analysis. If you want to know which individual orders had which combinations of sub-categories, then use order ID instead of customer ID.
- sub-category > sub-category
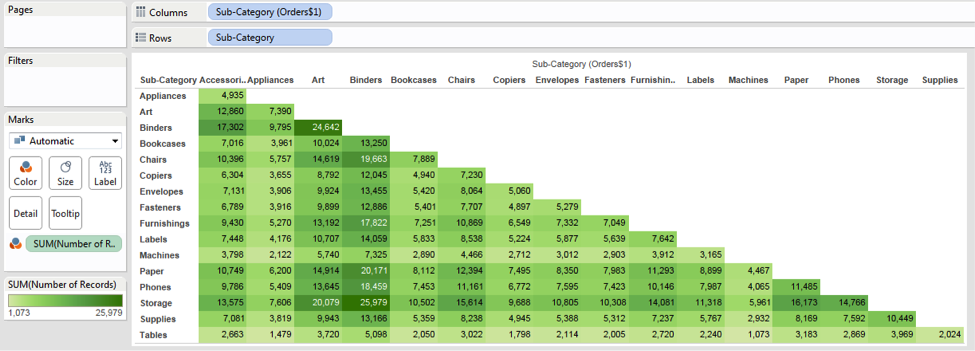
5. In the worksheet, bring sub-category from the first table to rows and sub-category from the second table to columns.
6. Add number of records to color, click label and check "show mark labels."
Explanation: The sub-category join clause should have a > operator because of the following:
An operator of < > would join the tables together when the sub-categories are not equal to one another for an individual customer. The result is a record for each time a combination was purchased from a customer, which sounds like what we want. However, this operator gives us a full matrix:

The operator > removes the mirrored upper half of the matrix, giving us only the desired bottom triangle.
How to request curriculum modules
To request curriculum modules, join the Tableau for Teaching User Group. Please note that this is a private group restricted to instructors, and you must be signed in to request access. We also invite you to contribute your own ideas and content through the group discussion board.
If you still need to develop your own Tableau skills, take advantage of our free on-demand training videos. Paid training options are also available. Both live and web-based, they focus on conducting deeper analysis with Tableau.
To learn more about how you can incorporate Tableau into your classes, watch our on-demand webinar.
Autres sujets pertinents

Data Literacy for All: Free data skills training for individuals and organizations
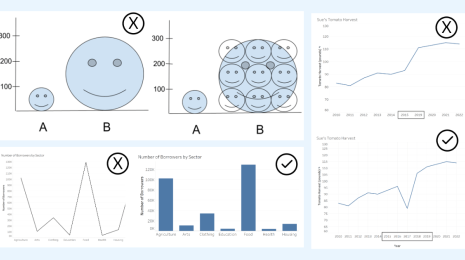
How to Spot Misleading Charts, a Checklist
 15 novembre, 2023

Boostez votre recherche d'emploi avec un CV Tableau interactif
 8 décembre, 2022
Les recruteurs ne consacrent que 6 secondes à la lecture d'un CV. Démontrez votre talent pour la visualisation des données et démarquez-vous en présentant votre CV de façon visuelle et interactive dans Tableau.
Abonnez-vous à notre blog
Recevez toute l'actualité de Tableau.