What’s New with Tableau User Groups
Tableau User Groups (TUGs) are inclusive meetup events for Tableau enthusiasts to connect, learn and discuss all things Tableau. Explore a curated list of highlights and content from a month of global user group events.


Welcome to the Tableau User Group Monthly, where you can find a curated list of highlights and content from a month of User Group events all over the globe. The User Group Monthly highlights content by topic, allowing readers to synthesize all the top meeting learnings. Share your TUG experiences and learnings using the #TableauUserGroup hashtag on Twitter.
What are Tableau User Groups?
Tableau User Groups (TUGs) are inclusive meetup events for Tableau enthusiasts to connect, learn and discuss all things Tableau. Find inspiration from your peers across geographies, industries, and interest while advancing your analytics skills. They can take place virtually or in person and are completely Community-led. Explore and join an existing user group or start one of your own here.
Featured upcoming virtual meetups
14th December | At the Higher Education TUG, Christy Simpson of Texas Tech University Health Sciences Center dives into how her university used Tableau to present an interactive online factbook.
15th December | Student x Community is a brand new TUG that will connect students to the wider community. Catch their next session, where Iron Viz and student Iron Viz winners Will Sutton, Michael Dunphy, and Christian Felix will share their insights about the competition and their journeys from students to champions.
15th December | The last Analytics TUG of the year will start with Social Ambassador Jade Wimpey talking about her journey with data visualization in 2022. Second, we have Public Ambassador Chimdi Nwosu digging into his #DuBoisChallenge data visualization submission. Lastly, Analytics TUG leader Sedale McCall will highlight some of the speakers and events from the past year and what you can look forward to in 2023.
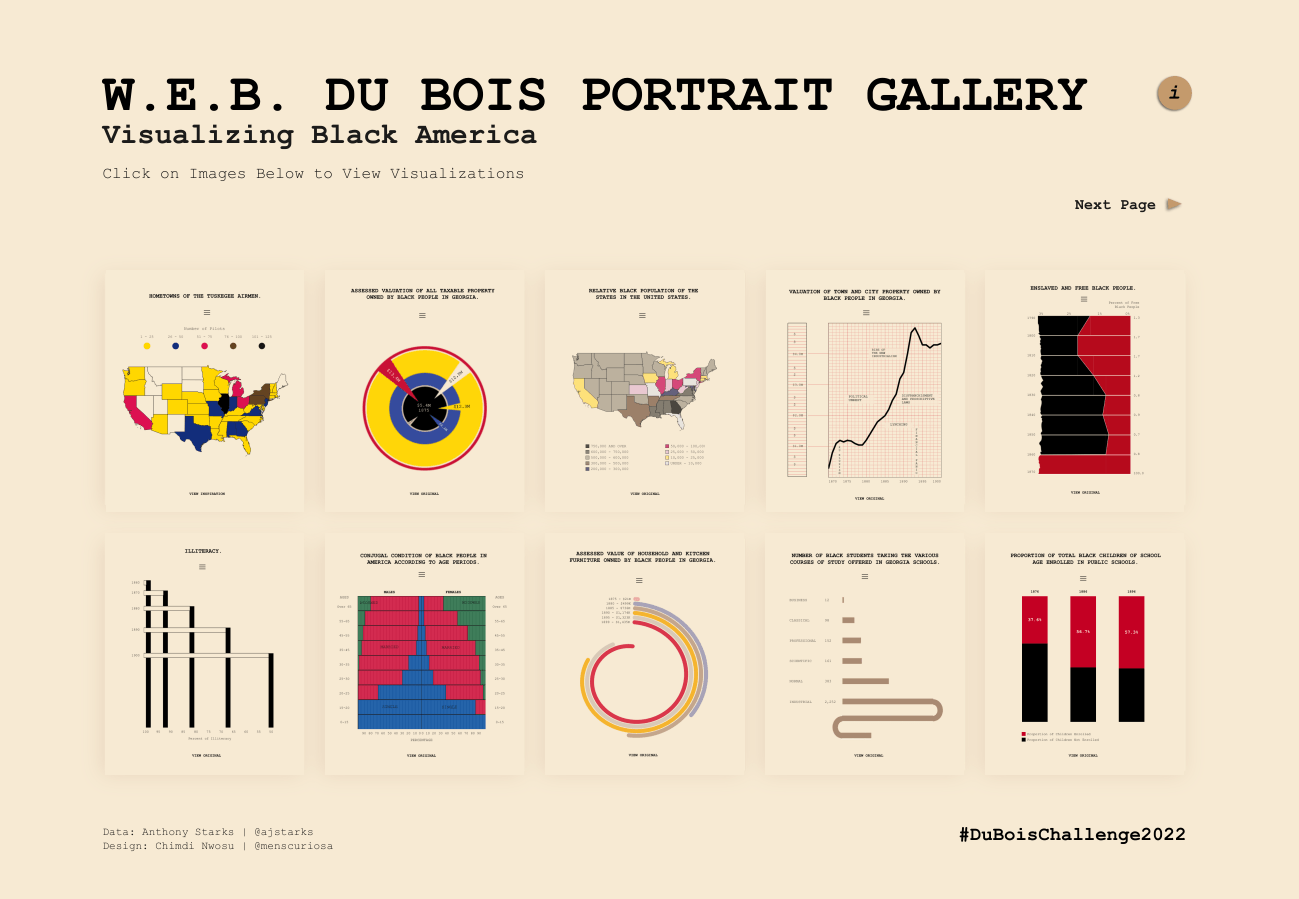
Tableau Public visualization: W.E.B. Dubois Portrait Gallery by Chimdi Nwosu
Learn from the Community with on-demand User Group meetups
Driven by Data but powered by people: At the London TUG, Community Drivers TUG Leader Amy Ryder, & Thierry Driver of Jaguar Land Rover spoke on how they implement a self-sufficient approach to analytics. Jaguar Land Rover moved from Tableau Server to Tableau Online in 2020 and underwent a radical digital transformation. The enablement piece now means all employees have access to a license, reflecting data in every part of the business and in every role.
Exploring the COVID care gap: At Data + Women Germany, Tanya Fischer & Romina Wiechern from The Information Lab Germany break down the data they have collected on how COVID has further impacted the care gap between men and women at home. Here, they talked about the pre-existing gender pay gap and the difference in measures like labor division and job changes.
How to create a viz resume: At the inaugural Student x Community TUG, Former Visionary and Iron Viz winner Tristan Guillevin demos how to create a Viz Resume and how to leverage the power of Tableau Public and the Community to help you get hired. Next former Student Ambassador Sabrina Elouardi shares her experience as a Student Ambassador and how the Tableau for Students Program and the Community helped her achieve a successful job in Data Analytics for a well-known sportswear brand.
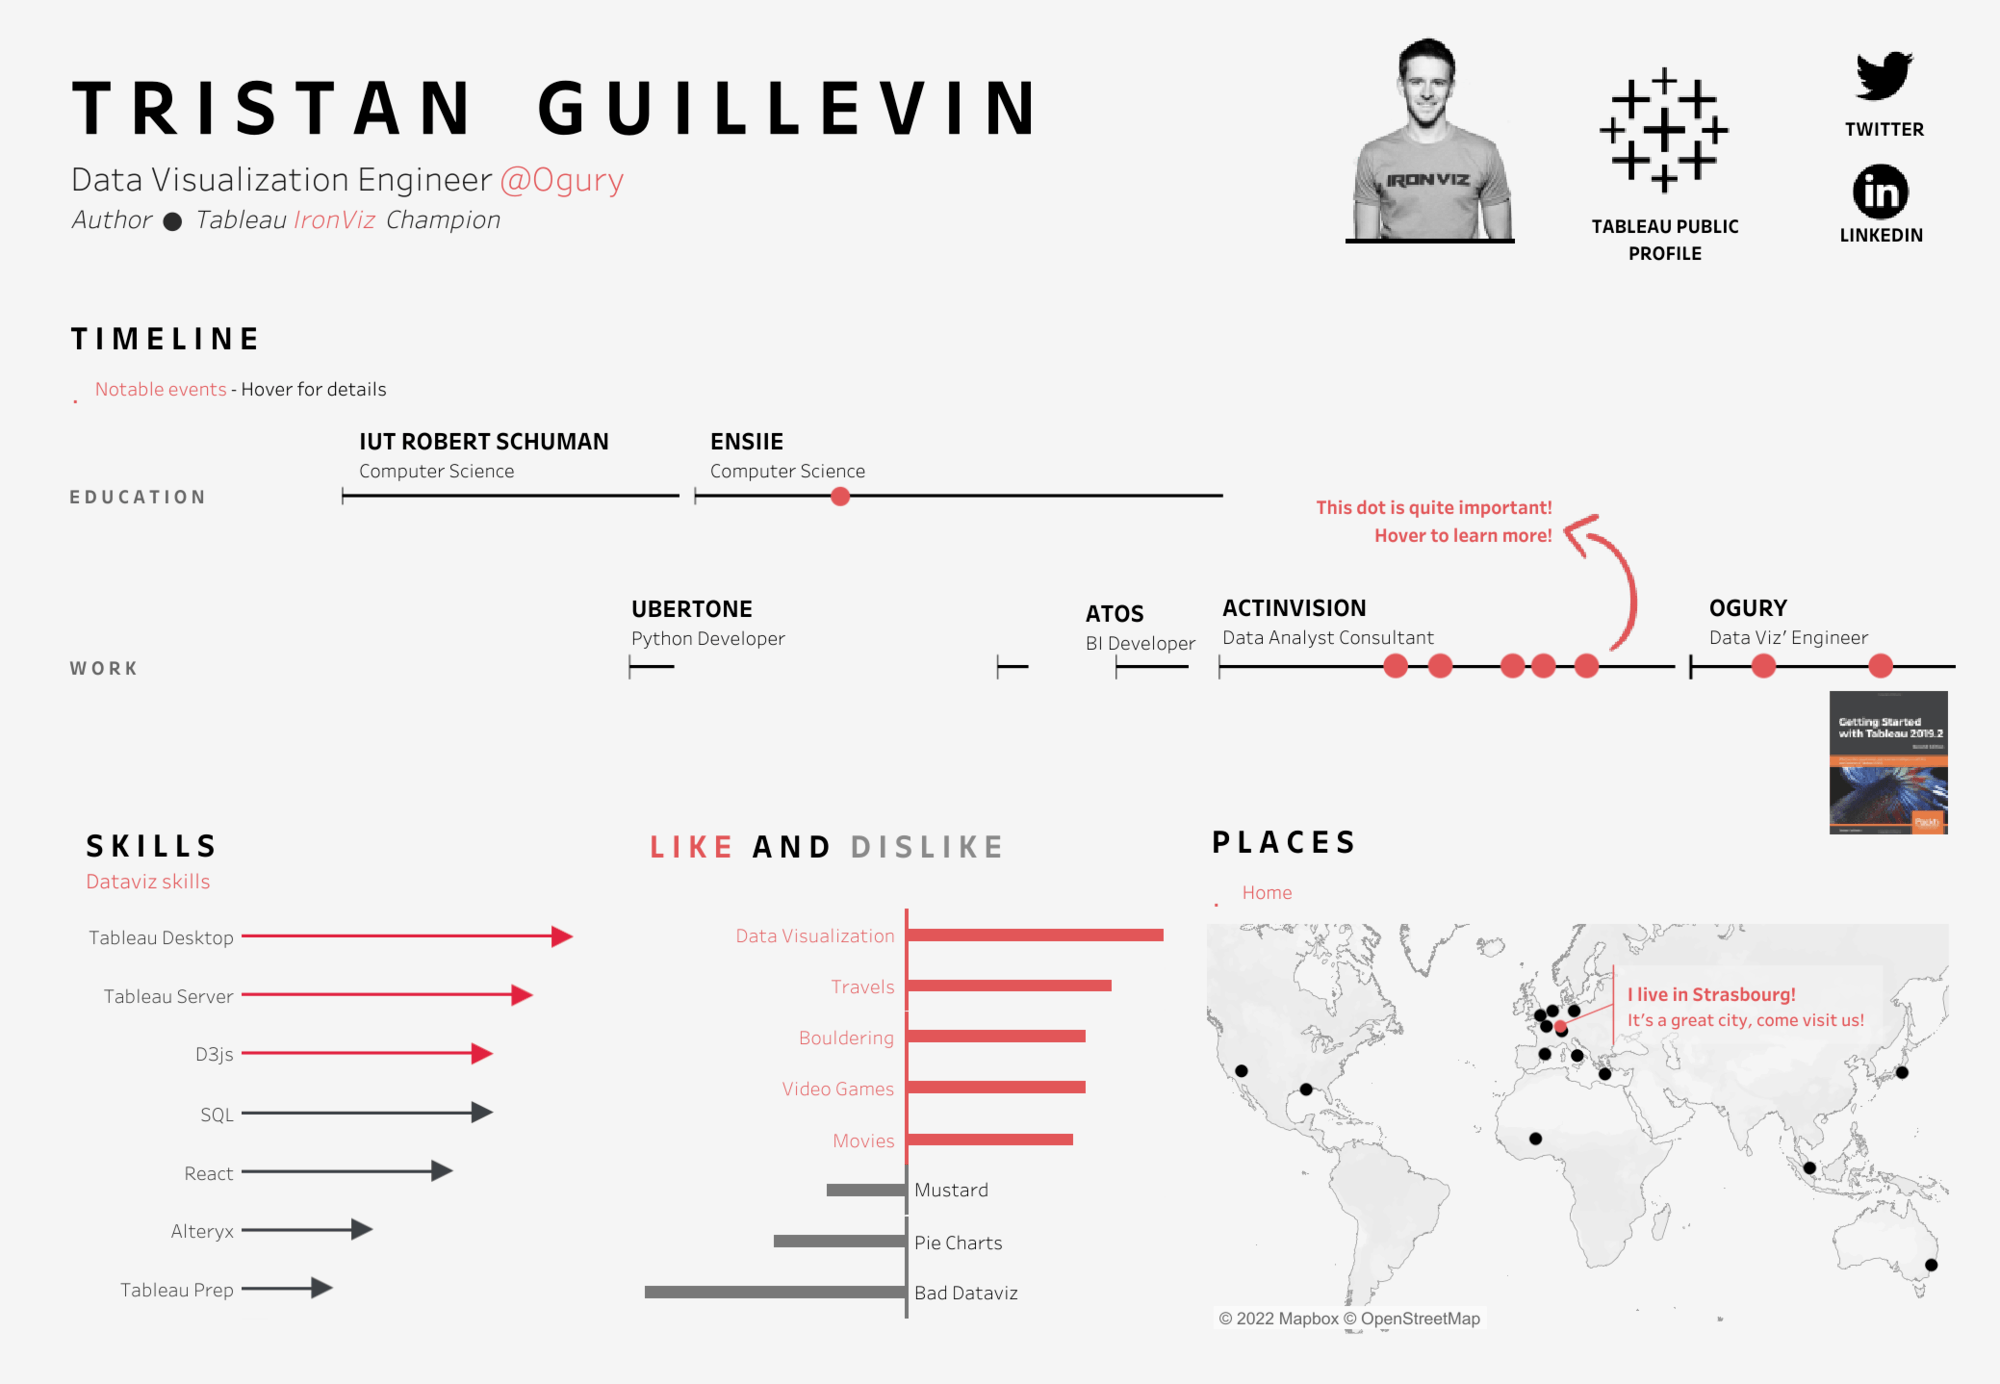
Tableau Public Visualization: Resume by Tristan Guillevin
Digital transformation and creating Tableau Champions: At the Dublin TUG, Managing Director Dave Hackett and Chief Technology Officer Kevin Lynch from The Information Lab explain how to bridge the gap between SAP and business intelligence to create a more accountable, performance-driven culture within finance teams. This presentation dives into their shared real-world experience in helping global enterprise organizations reap the benefits of a more streamlined data-driven culture. Next up, Deirdre Hayes speaks about how VHi Healthcare has created a community of Tableau Champions, offering valuable insight into the process and benefits of creating Tableau Champions in an organization.
From Data to daily automated insights: Hear from Sébastien Cousto at the Football TUG on how after working with multiple clubs in France, he joined Parma Calcio 1913 in January 2022 to lead Data & Analytics in the Performance & Analytics Department. His first objective was to structure and design a reliable, cost-effective, and scalable infrastructure to power the Analytics club-wide, from the First Teams to the Academy.
Autres sujets pertinents

Meet Iron Viz 2024 Finalist Jessica Moon
 15 avril, 2024

DataFam Roundup: April 8–12, 2024
 12 avril, 2024

Meet Iron Viz 2024 Finalist Pata Gogová
8 avril, 2024
Abonnez-vous à notre blog
Recevez toute l'actualité de Tableau.