TCC12 Opening Keynote Recap: Introducing the Kraken
"Our mission at Tableau is to be a catalyst for creative thinking.... We will be summoning a new Third Age of Business Analytics."
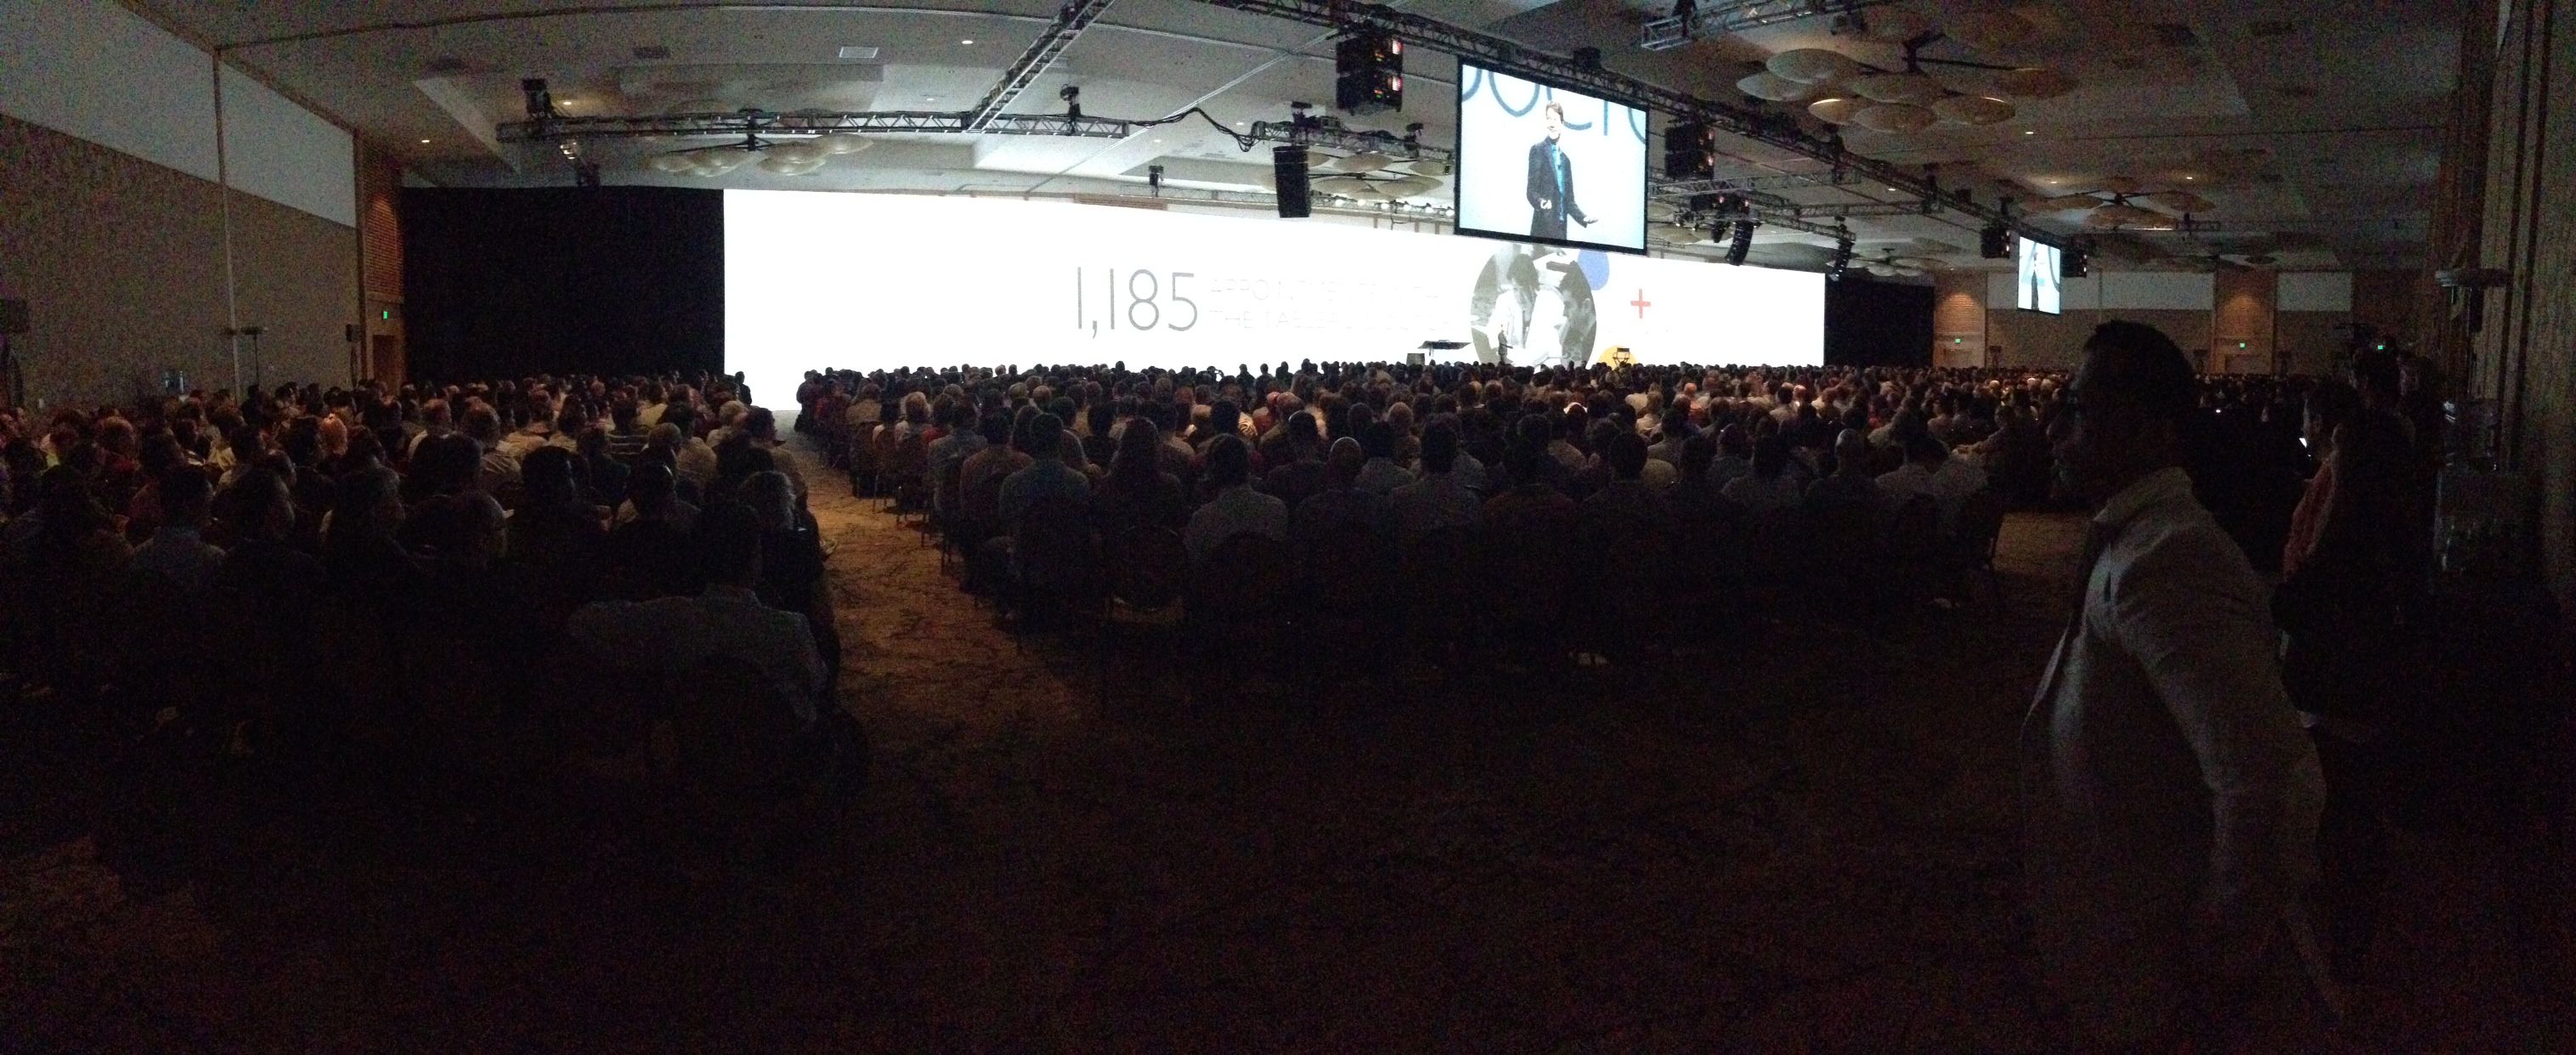
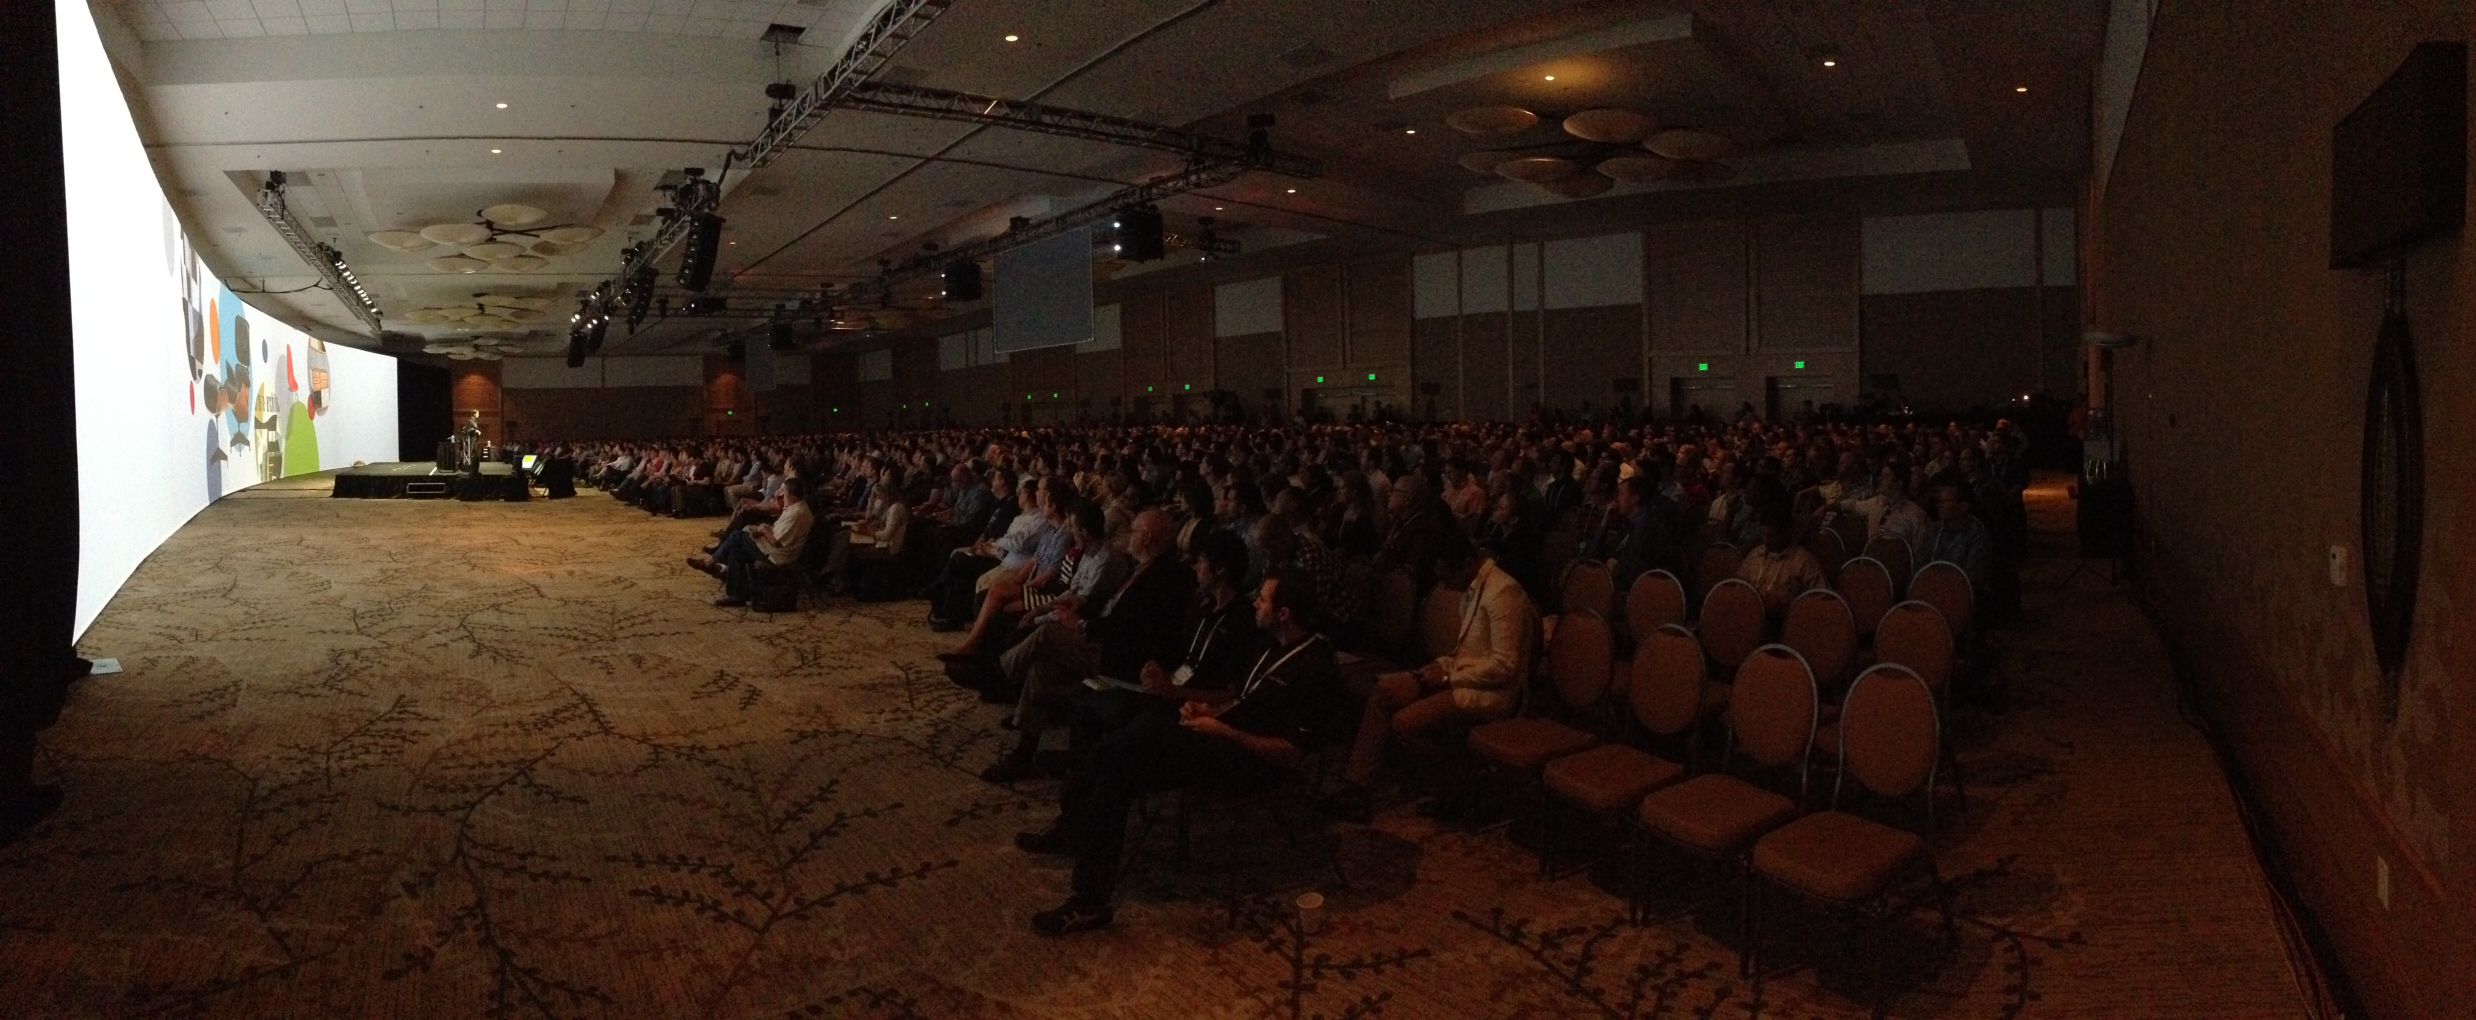
If you remember the crowd for Tableau CEO Christian Chabot's keynote talk at the 2011 Tableau Customer Conference in Las Vegas, and wondered how it might be possible to top it, you may have been surprised to be in the room as Chabot spoke today from the 2012 conference.
Chabot starts a history of analytics by tracing the ages of business analytics from 1945, with General Robert McNamara and his team of "Whiz Kids" tracking not only the US bomber force, but more critically where the spare parts required to maintain and keep those planes in flying trim - a First Age, where an organization can complete a limited number of projects with limited scope under fairly rigid top-down control.

He continued, defining the Second Age of the 1980s and 90s- the Information Age where the personal computer started gaining prominence and applications specifically designed for analytics were being created- but where the output of these applications was often tedious, encyclopedic, and crippling in its depth and complexities which had an effect of paralyzing and stupifying those who sought the wisdom in their data.
The Third Age, Chabot postulates, starts with 2010. He notes that an off-the-shelf computer now has more power than mainframes of the First and Second Ages, and mobile devices extend this power to allow people to be dynamically creative in ways which simply weren't possible at any point in the past, and notes that Tableau is positioning itself at the leading edge of this new wave to
Chabot cites John Chambers of Cisco Systems: "If I get each of the people to report to me to consult some data before making a decision, and they do the same with their people, those are a million decisions, driven by data, which are better made than they would have been in the past- and better than my competition can make."
The Principles of Tableau Product Development
Passing the torch to Tableau Chief Development Officer (CDO) and co-founder Chris Stolte, who dives into three core principles.
These three principles:
- Software needs to be easy and useful
- It needs to be fast and visual
- And it needs to be ubiquitous
Stolte goes back to his days at Stanford University as a doctoral student under Dr. Pat Hanrahan, talking about the learning process about building visualizations to test hypotheses. These visualizations took weeks of coding C++ and OpenGL code, and all too often proved in short order that the initial hypotheses were invalid, resulting in a need to recode and redevelop. This work, though, led not only to the initial work which would grow into Tableau, but helped define the core principles.
First, software needs to include the human in the process. It should be essentially transparent so that the person using it can concentrate on the focus of what needs to be done, and without getting stuck in the software.
It's no longer acceptable to take three weeks to build a visualization to test a hypothesis only to realize that that theory is inaccurate. Things need to be fast, the conclusions drawn need to be clearly presented, and friendly to users who aren't necessarily expert in all the minutae of their data.
Finally, analytics need to be available wherever they are. Things need to be available on all devices, on all operating systems, and by focusing on doing so, we put the power to innovate in the hands of the analyst.
Developers on Stage Preview Tableau Version 8 -- Project Name "Kraken"
No Tableau Customer Conference would be complete, however, without the popular Devs on Stage presentations, showcasing some new feature work.
As has become common, Dav Lion led the way in the parade of Tableau developers, and showed off several new visualization styles which will be available in Tableau 8.
New visualization types which will make their debut in Tableau 8 will include Tree Maps, Bubble Charts, Word Clouds, and there will be significant revisions to Stacked Marks which will make them significantly more friendly to use and more informationally valuable.
User Interface Design Lead Jeff Pettiross followed, talking about the redesign of the Marks Card. This work will include allowing multiple fields to be used in labels, where they can be easily rearranged to change view on the fly, rich text editing in the field.
Sets.Creating sets from within a view. Merging sets for on-the fly analytics. Visual joins between these ad-hoc sets.
Scott Sherman extended the idea of "Beautiful Visualization" highlighting a number of Dashboard redesign features. Included in these, the concept of being able to overlaying legends and even other views on views to maximize visual presentation. Also added for Tableau 8, the concept of shared filters, and expanding the scope of annotations including images to make the creation of beautiful and interactive infographics on the fly.
Francois Ajenstat, Director of Project Management, showed a handful of new advanced analytics features which will debut with the release of Tableau 8. These included Cohort analysis, forecasting, and visual grouping; introducing the concept of "using your mouse as a paintbrush to create a group and allowing it to be visually dynamic without losing the context within the rest of the view". This has the potential to be game-changing, as previously doing this sort of grouping would have aggregated the grouped data, thus making it functionally misplaced in context in the remainder of the dataset.
John Dance introduced some of the fundamental changes in Tableau's Viz Engine, showcasing the speed and power of this rewritten technology by showing off a number of famous paintings presented through data visualization, zooming in and out to seamlessly render thousands and millions of data points- both in Desktop and, for the first time, in a web browser within Server.
Tableau Server core development lead Justin Rockwood showed off new integration and management features, including a new JavaScript API, allowing the embedding of Tableau visualizations within web pages with user-comtrolled filtering external to the Tableau view. Things don't stop there. This JavaScript API allows for the inclusion of external data as well, empowering users to add data, programmatically filter, even blend data from both Tableau views and non-Tableau data and draw insights from it without ever having to bring it directly into Tableau- allowing users who may need to interact with corporate portals, but where they don't always have the control to completely use Tableau Server to embed their visualizations.
Robert Morton, self-confessed data nerd, talked about expanding the data connections available within Tableau, revealing that Tableau 8 will add the ability to connect to SalesForce, Google Analytics, SAP BW/HANA, Cloudera, MapR, HortonWorks, and Teradata TBIO.
Last, but not least, Jeff Raymakers, of the Server development team dazzled the audience by showing off something which will be revolutionary looking at the core principle of ubiquity. Server will be more user-friendly and flexible in Tableau 8, presenting views and workbook thumbnails, allowing for added user controls to resize grid layouts. The user navigation sidebar will have an entirely new look, which should make Server both more intuitive and more useful.Server will now also include the ability to subscribe to a particular view and have the lastest version delivered to your email inbox with just a few easy clicks.
Perhaps even more stunning, starting in Tableau 8, Users will be able to do some additional analysis on the fly with the advent of Web Authoring - a departure from requiring workbooks and their datasources to be downloaded and opened in Tableau Desktop. The potential for easy, fast, useful, ad-hoc analysis, not just in Desktop, but from within Tableau Server.
The Third Age of Business Analytics
Closing the presentation, Christian Chabot returned with his iPad, showing subscriptions and editing from within the Tablet application as well.
Tableau 8. On your desktop, server, or mobile device. Easy. Useful. Fast. Visual. Ubiquitous. And, let's not forget, surfing the leading edge of the wave of the Third Age of Business Analytics.
Abonnez-vous à notre blog
Recevez toute l'actualité de Tableau.


