It's Ski Time
Ivo Salmre is a recent addition to the Tableau team. He came to Seattle most recently from the city of Vancouver, B.C., and he's a ski nut, like many of us at Tableau.
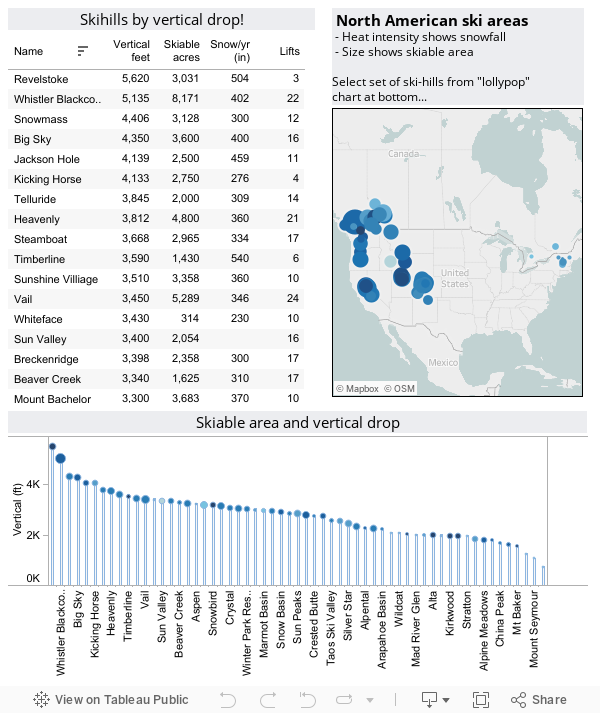
Ivo created this visualization of all the ski areas in North America. It's great for comparing vertical drop, annual snowfall and more. While it's a great resource for any skier, I suspect he did because he left his skis up at Whistler and was trying to convince himself it was well worth the trip to get them.


Ivo Salmre is a recent addition to the Tableau team. He came to Seattle most recently from the city of Vancouver, B.C., and he's a ski nut, like many of us at Tableau.
Ivo created this visualization of all the ski areas in North America. It's great for comparing vertical drop, annual snowfall and more. While it's a great resource for any skier, I suspect he did because he left his skis up at Whistler and was trying to convince himself it was well worth the trip to get them.
If you've been to Whistler, you know that it is.
Click for the the powder-ski version (i.e. wider view) of the viz with even more data.
One final note from a Northwest skier: please visit Utah and Colorado. We like having all this good snow to ourselves.
Suscribirse a nuestro blog
Obtenga las últimas actualizaciones de Tableau en su bandeja de entrada.