Tableau tip: How to sort stacked bars by multiple dimensions


Note: The following is a guest post by Tableau enthusiast Matt Chambers.
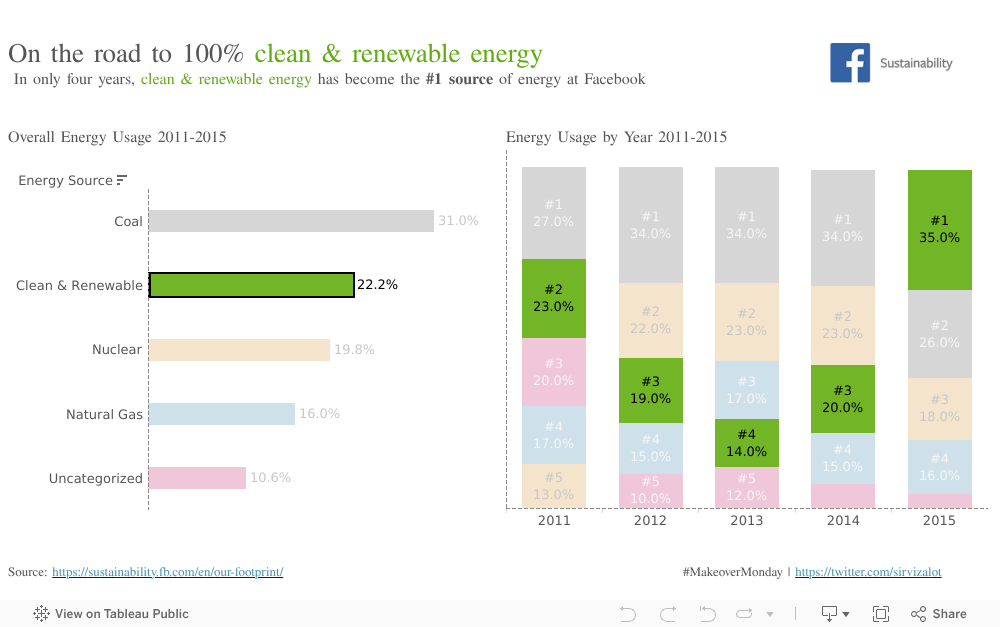
For Makeover Monday, I wanted to tell the story of how Facebook is making an effort to make clean and renewable power its primary source of energy. I wanted to be able to sort the stacked bars by energy usage percentage by year. Here's how it's done:
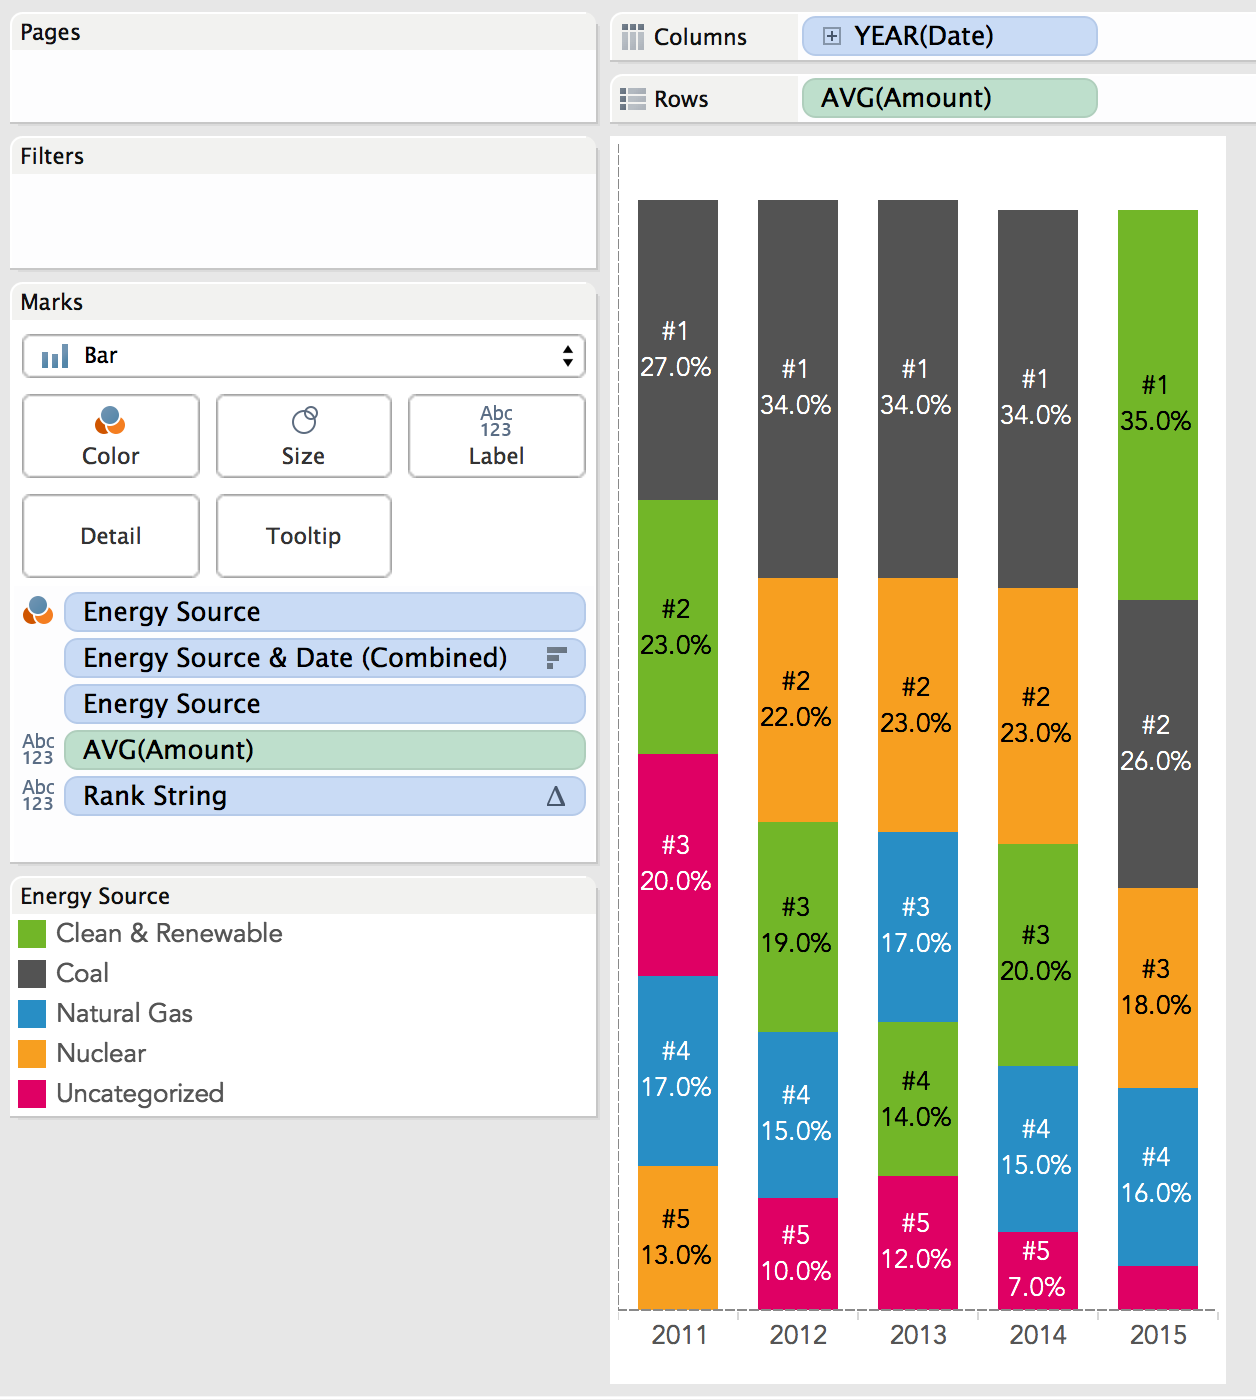
1. Build your stacked bar chart in Tableau.

2. Create a combined field using the dimensions you want to sort by. In this case, I want to sort by energy source by year.

3. Drag the combined field to the detail and sort by the measure. Here, I am sorting by Amount.

4. Finally, drag the dimension that you are sorting by to the detail. I am using Energy Source in this example.
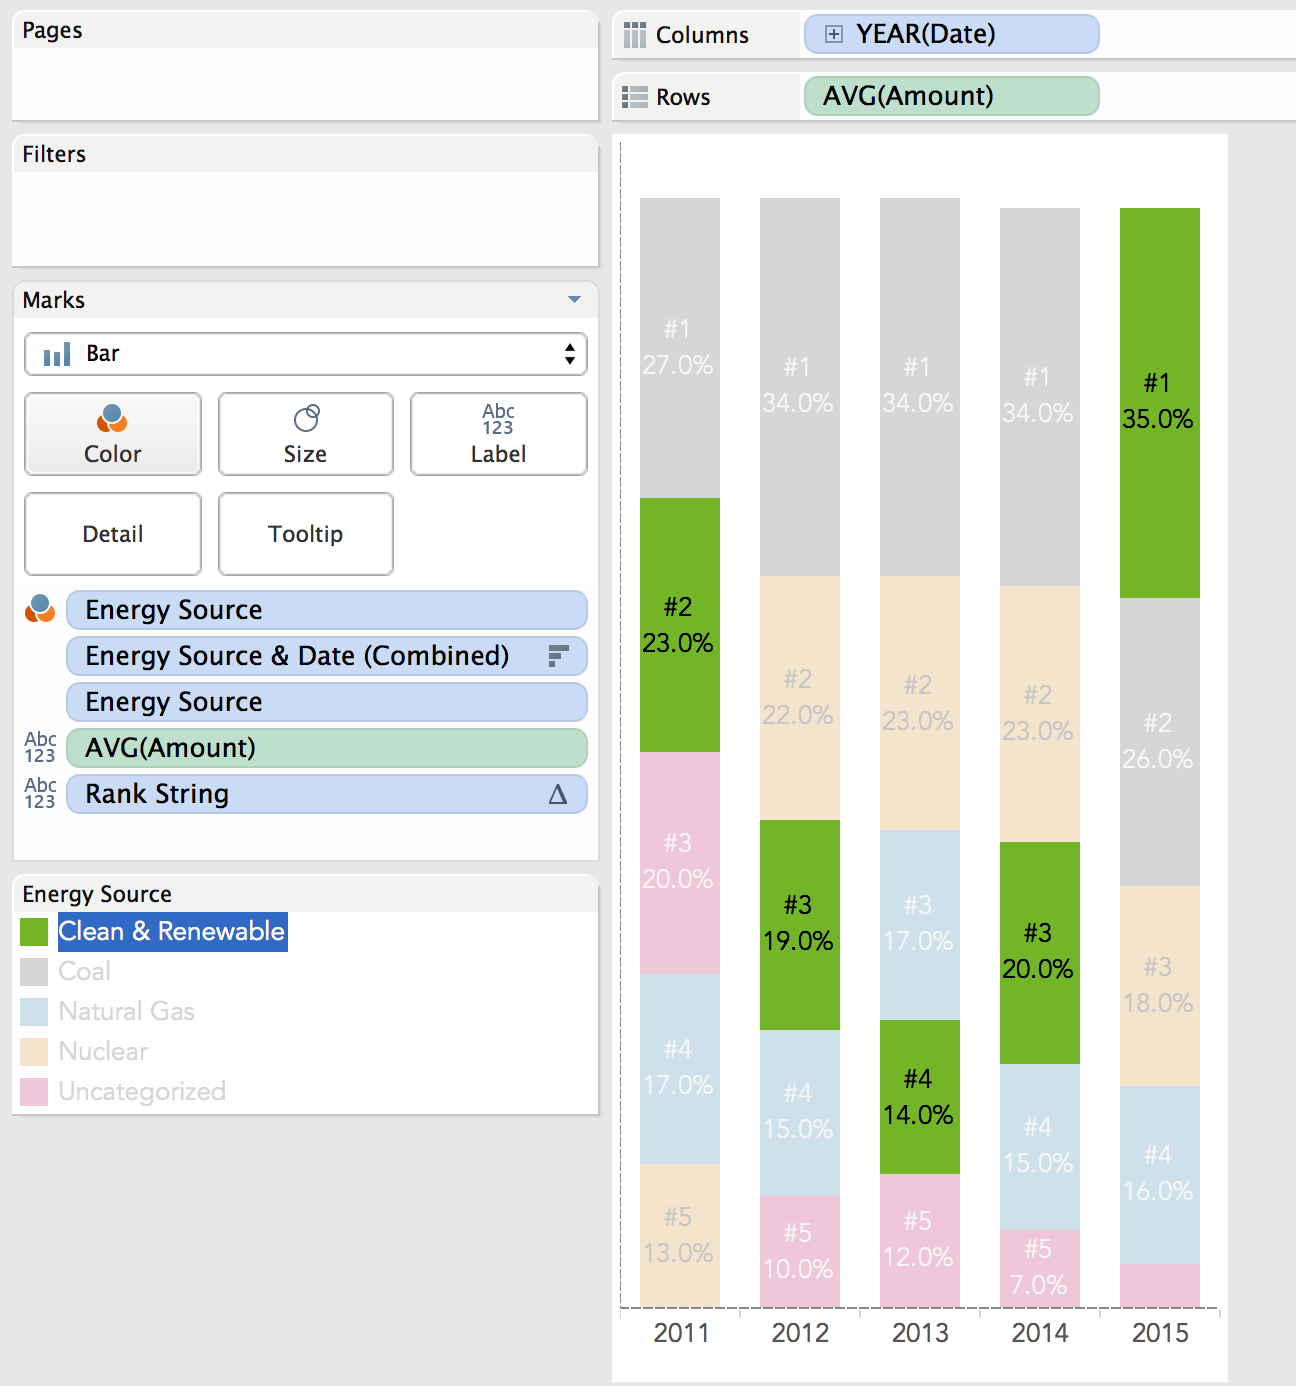
5. Now you have a stacked bar that is sorted by two dimensions. In my example, it is sorted by energy source and date. This allows for some nice interactivity that allows you to show trends and magnitude simultaneously. In my example, I am using it to show the rank of the energy sources while also showing the magnitude against other energy sources.
Please comment below with any questions or download the workbook to see how it's done.
For more tips, tricks, and vizzes by Matt, check out his Tableau Public profile page and his blog. You can also connect with him on Twitter @sirvizalot.
Historias relacionadas

Visualizing Women's Impact to History Through Data Visualization
 18 Marzo, 2024

Behind the Viz: Adrian Zinovei Helps You Design Your Next Dashboard
1 Marzo, 2024

Charting the Heart: Data Visualizations on Love
 14 Febrero, 2024
Suscribirse a nuestro blog
Obtenga las últimas actualizaciones de Tableau en su bandeja de entrada.