One Data Set, Many Stories: Introducing the Reviz Project


Note: The following is a guest post by former Tableau Zen Master Nelson Davis. Nelson is pictured above (left) along with Matt Chambers and Alex Duke.
“One data set. Three views. One conversation with multiple talking points.
“This should be our communal goal with all data visualization. Humans are social creatures. We learn through conversations. Our opinions sway and change with the ebb and flow of these conversations. Imagine being able to have this conversation with data. We needn't be content with one static chart or one interactive dashboard; we should start with a chart that asks a question and evokes a response.”
- Andy Cotgreave, October 2014 ("Why a Chart Should Start, Not End, a Conversation")
The above quote from Andy comes from a series of events in which three different people took the same data set and told three different stories through data visualizations. The data had been seen thousands of times, but each person examined it with a different perspective and turned it on its head. And the stories told had a tremendous impact in three unique ways.
With the new year, I wanted to be more intentional about creating opportunities to have an impact by telling stories. I wanted to focus on ways that people could be moved by stories told with data, knowing that when you put the two together, you multiply the effect of both.
I hope to grow in many ways this year, but one of my main focuses is on data storytelling. Given all of this, I have partnered with Alex Duke and Matt Chambers on this journey that we are calling the Reviz Project.
The Reviz Project
The project seeks to systematically do what happened by chance back in 2014—take a common data set and have its story told in at least three different ways. The goal is to change the way we look at the world and the way we look at data, and to see the humanity in both. It is our intent not just for us to chase after this; rather, we invite the community to join in as well. Here are the details.
Week One: The Data
Each month, there will be one leader and two followups. In the first week, the leader will prepare an open-source data set for the team and the community to use. This will be the main data source.
Week Two: The Leader
The leader will publish his or her viz on Tableau Public and the data on the Reviz blog. It is highly encouraged that the leader blogs about the creation process (data collection and vizzing techniques).
Week Three: The Followups
The followups are required to use the same data set published by the leader to create a viz that tells a story that is different from the leader's.
Week Four: The Community
Community members are invited to use the published data to tell their own story. Visualizations that are submitted by the end of week four will be featured on the community page of the Reviz blog.
Our Own Perspectives
Each of us have our reasons for taking this on. For Matt Chambers, the Reviz Project is about perspective. “It allows us to take a data set and tell different stories from different perspectives with data visualization. We no longer have to rely on the stories that are being told in the media; if the data is available, we can find our own stories,” he says.
For Alex Duke, finding the story and sparking a conversation with an impactful visualization is the goal. Alex believes that impact and action are the keys: “I didn’t want to just create a viz. I wanted to tell a story that mattered to me and hopefully would impact others. I wanted the focus of all of my visualizations to be about offering a solution to the problem or how the reader can get involved with the issue at hand. We’re not focusing on easy topics; instead, we’re using data to bring to light many issues that can be solved if people are more aware.”
Personally, I view data as the “what.” Unadulterated and raw, it is the reality. Data needs a story to bring it to life. By asking the question “why?” we begin to breathe life into the data, which brings about the opportunity for assumptions to change and perspectives to shift. Focusing on the why has brought about some of my most impactful work and has truly changed the way I see the world in the day-to-day. It humanizes the data and creates emotion based on fact.
How We Visualized Gun Deaths in America
In the first month of the Reviz Project, Matt took the lead and exposed us to the stark issue of gun deaths in America. Other projects have looked at gun homicides alone, but Matt wanted to tell a more complete story. “Once I started to analyze the data, it was clear that suicides were a very serious problem even though the media mostly reports on homicides or mass shootings,” he says. Matt came up with this powerful beginning to the conversation:
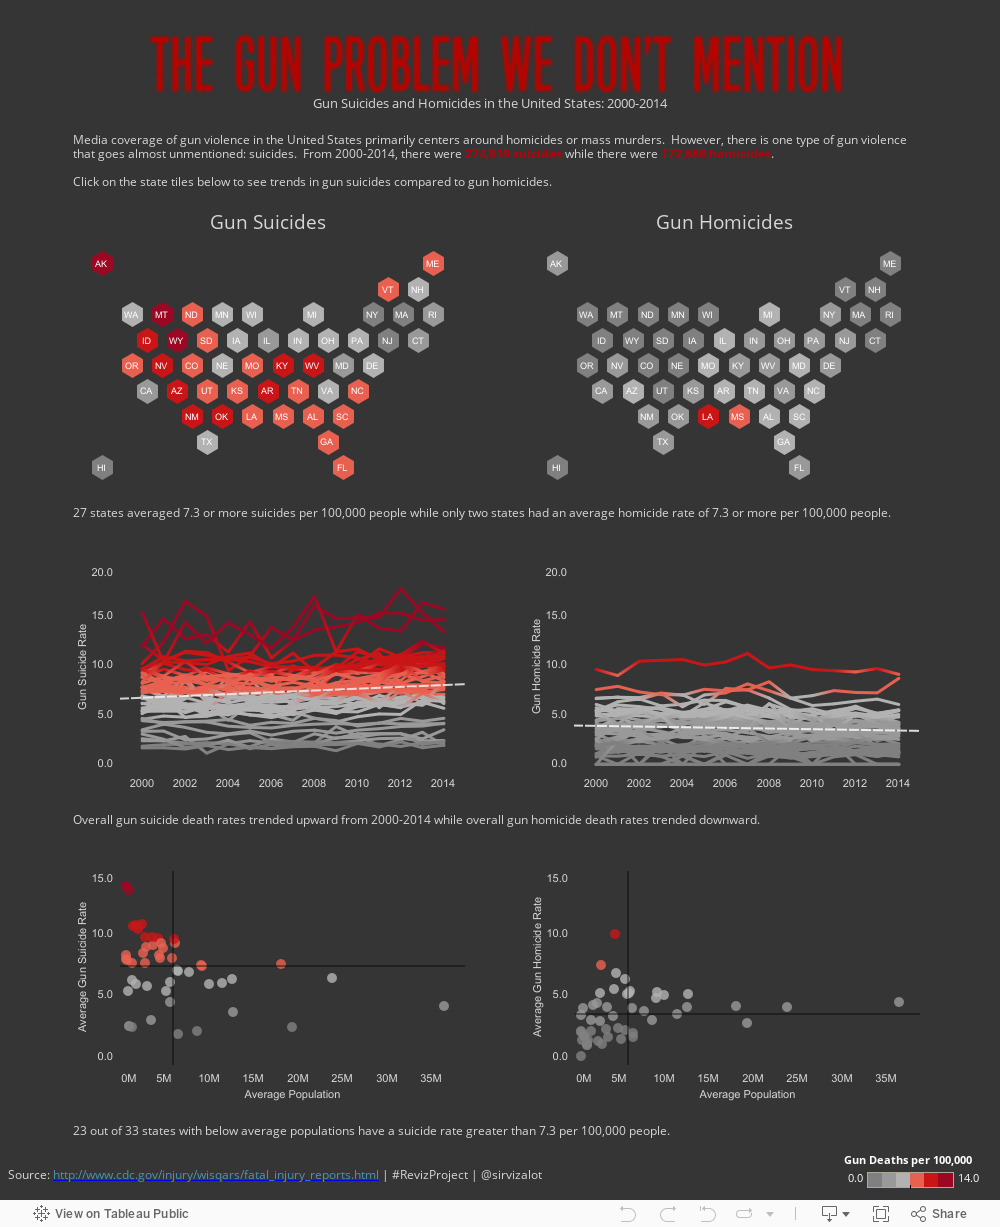
I knew I wanted to show the impact, and make the audience FEEL the loss of years to gun deaths, but it was after seeing Matt’s viz that I decide to focus only on suicide. Suicide touched my life back in high school and had a big impact.
I also realized from Matt’s viz that in 2014, suicide accounted for nearly two-thirds of gun deaths, yet we never hear about it or talk about it—certainly not like gun homicides. So I decided to add up all the years that were lost from the moment someone pulled the trigger to when they would have statistically died without the gun. I called that difference “the suicide gap” and you can see the impact below:

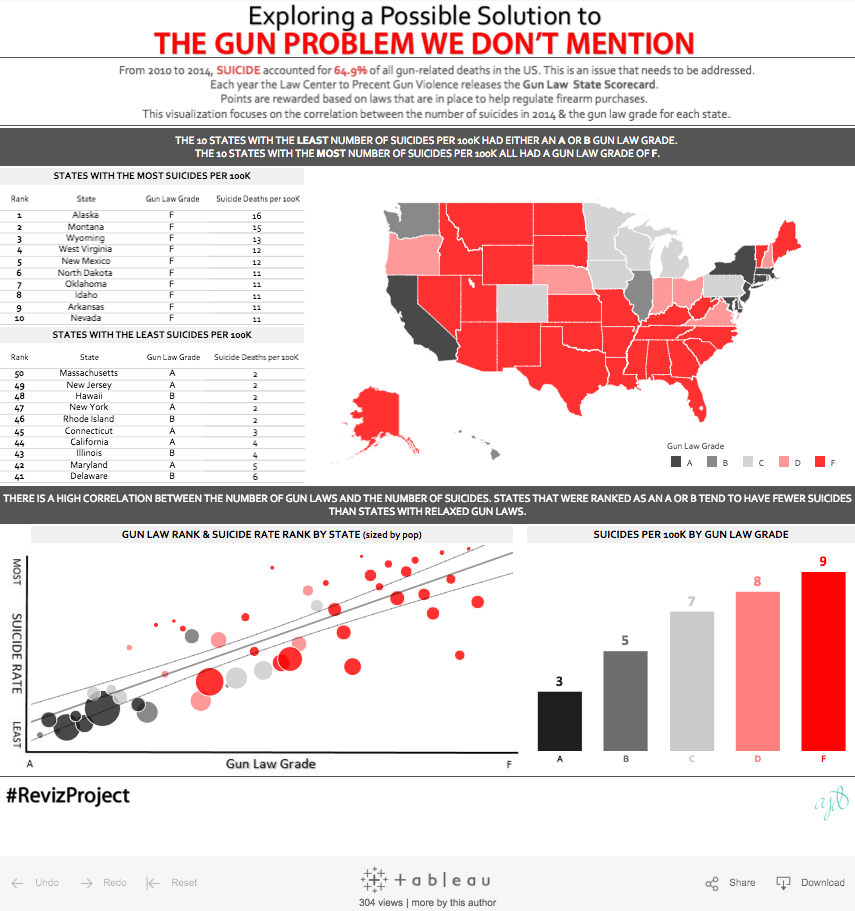
Alex took the problem that Matt had identified, and went looking for a data-driven solution. She found it as she looked at the impact of gun laws in each state and compared that to the suicide rate. She highlighted a clear statistical trend that shows gun laws have a clear impact on reducing suicides. See for yourself below:

Alex and I had taken Matt’s work and found new stories to tell. The best part was that the community was up to the challenge as well. We received a number of revizzes during the last week of January, including one from Tableau’s own Ben Jones.
From Matt’s perspective, it was awesome to see how this “led others to ask questions about why there has been an increase in suicides over time," he says. "Is there a correlation with gun laws, is it related to smaller populations, or is it related to gun ownership? These were the questions that the Tableau community was inspired to ask, and since we provided our data, they were able to use data visualization to tell their own stories.”
Now it’s your turn to get involved. Alex is taking the lead for February and she’s got us focused on human trafficking—the stories of lives sold into modern-day slavery. It’s beyond heartbreaking, yet many of us don’t see the effects of this cruel trade. Our goal will be to show that impact.
We’d love for you to join us by downloading the data and telling your own story. Who knows the impact you might have?
For more information on the Reviz Project, visit the project's website and follow the Twitter hashtag #revizproject.
Suscribirse a nuestro blog
Obtenga las últimas actualizaciones de Tableau en su bandeja de entrada.