#DevsOnStage: What’s coming soon in Tableau


Tableau devs took to the stage during the #DevsOnStage keynote at TC to share a sneak peek of what's ahead.
Day in and day out, we work for data people like you. Every part of our product roadmap is designed to help you maximize the impact of your data.
You already know Tableau helps you and your organization uncover insights in your data, and there’s much more ahead. As we shared on stage at TC, we have a number of new capabilities in the works, including dozens requested by you on the Ideas Forum.
I have the pleasure of leading Tableau’s talented engineers, and we’re excited about our vision and plan for what’s ahead. Let me tell you about some of the features we're working on.
More analytical power
First, let me tell you about maps. Soon, when you zoom in on your map, your map will reveal more data. With this feature we’re calling automatic drill, I can drill into new levels of detail just by zooming. Watch how the level of detail changes from state to county, to postal code as I zoom in:
But wait, did you notice anything else when I zoomed in? Look again, and you’ll see map scaling, one of the most requested features on our Ideas Forum! We’re also working on a native connector to spatial files. That way, you can go beyond the data built in to Tableau and bring in whatever you need.
We’ve got great news for Python fans: We’re working on a direct integration with Python! You’ll be able to leverage the statistical power of Python in Tableau, and interactive analysis of your models will be one calculation away. Data scientists will soon be able to model using the two most popular advanced analytics languages, R and Python, right in Tableau.
And here’s an idea that’s gotten more than 800 votes on the Ideas Forum: What if you could set your viz to automatically filter to the latest date? That will soon be a reality with a feature we’re calling Filter Presets. Simply bring up the filter dialogue, and select “latest date value.” Now the filter will update dynamically to the latest date.

Now let’s talk about visualizing trends over time. Sometimes you want to visualize discrete change. That’s why we’re working to add step and jump lines.
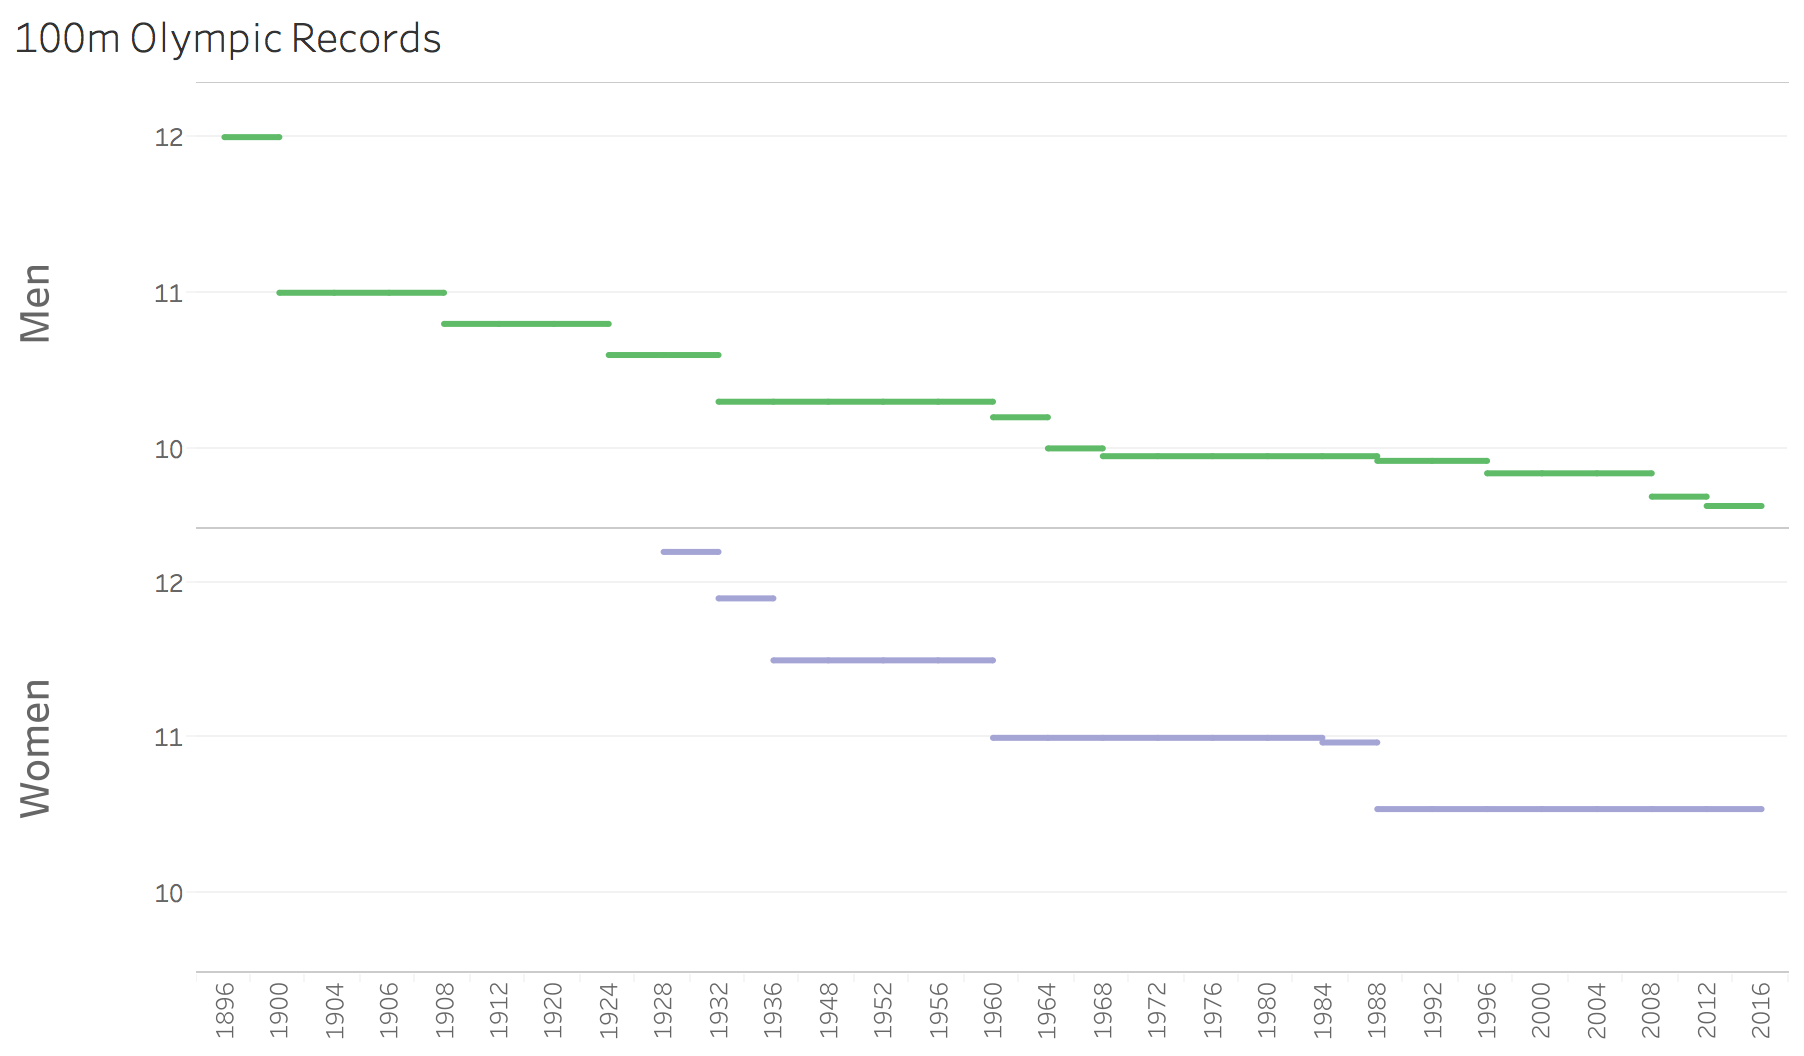
These lines help you visualize changes at specific times as well as periods of no change—when an Olympic record is broken or the price of stamps rises, for example.
Dashboard design
When it comes to data-viz design, the small choices you make add up to a cumulative effect. That’s why we’re working to help you make the right choices about space, layout, and typography.
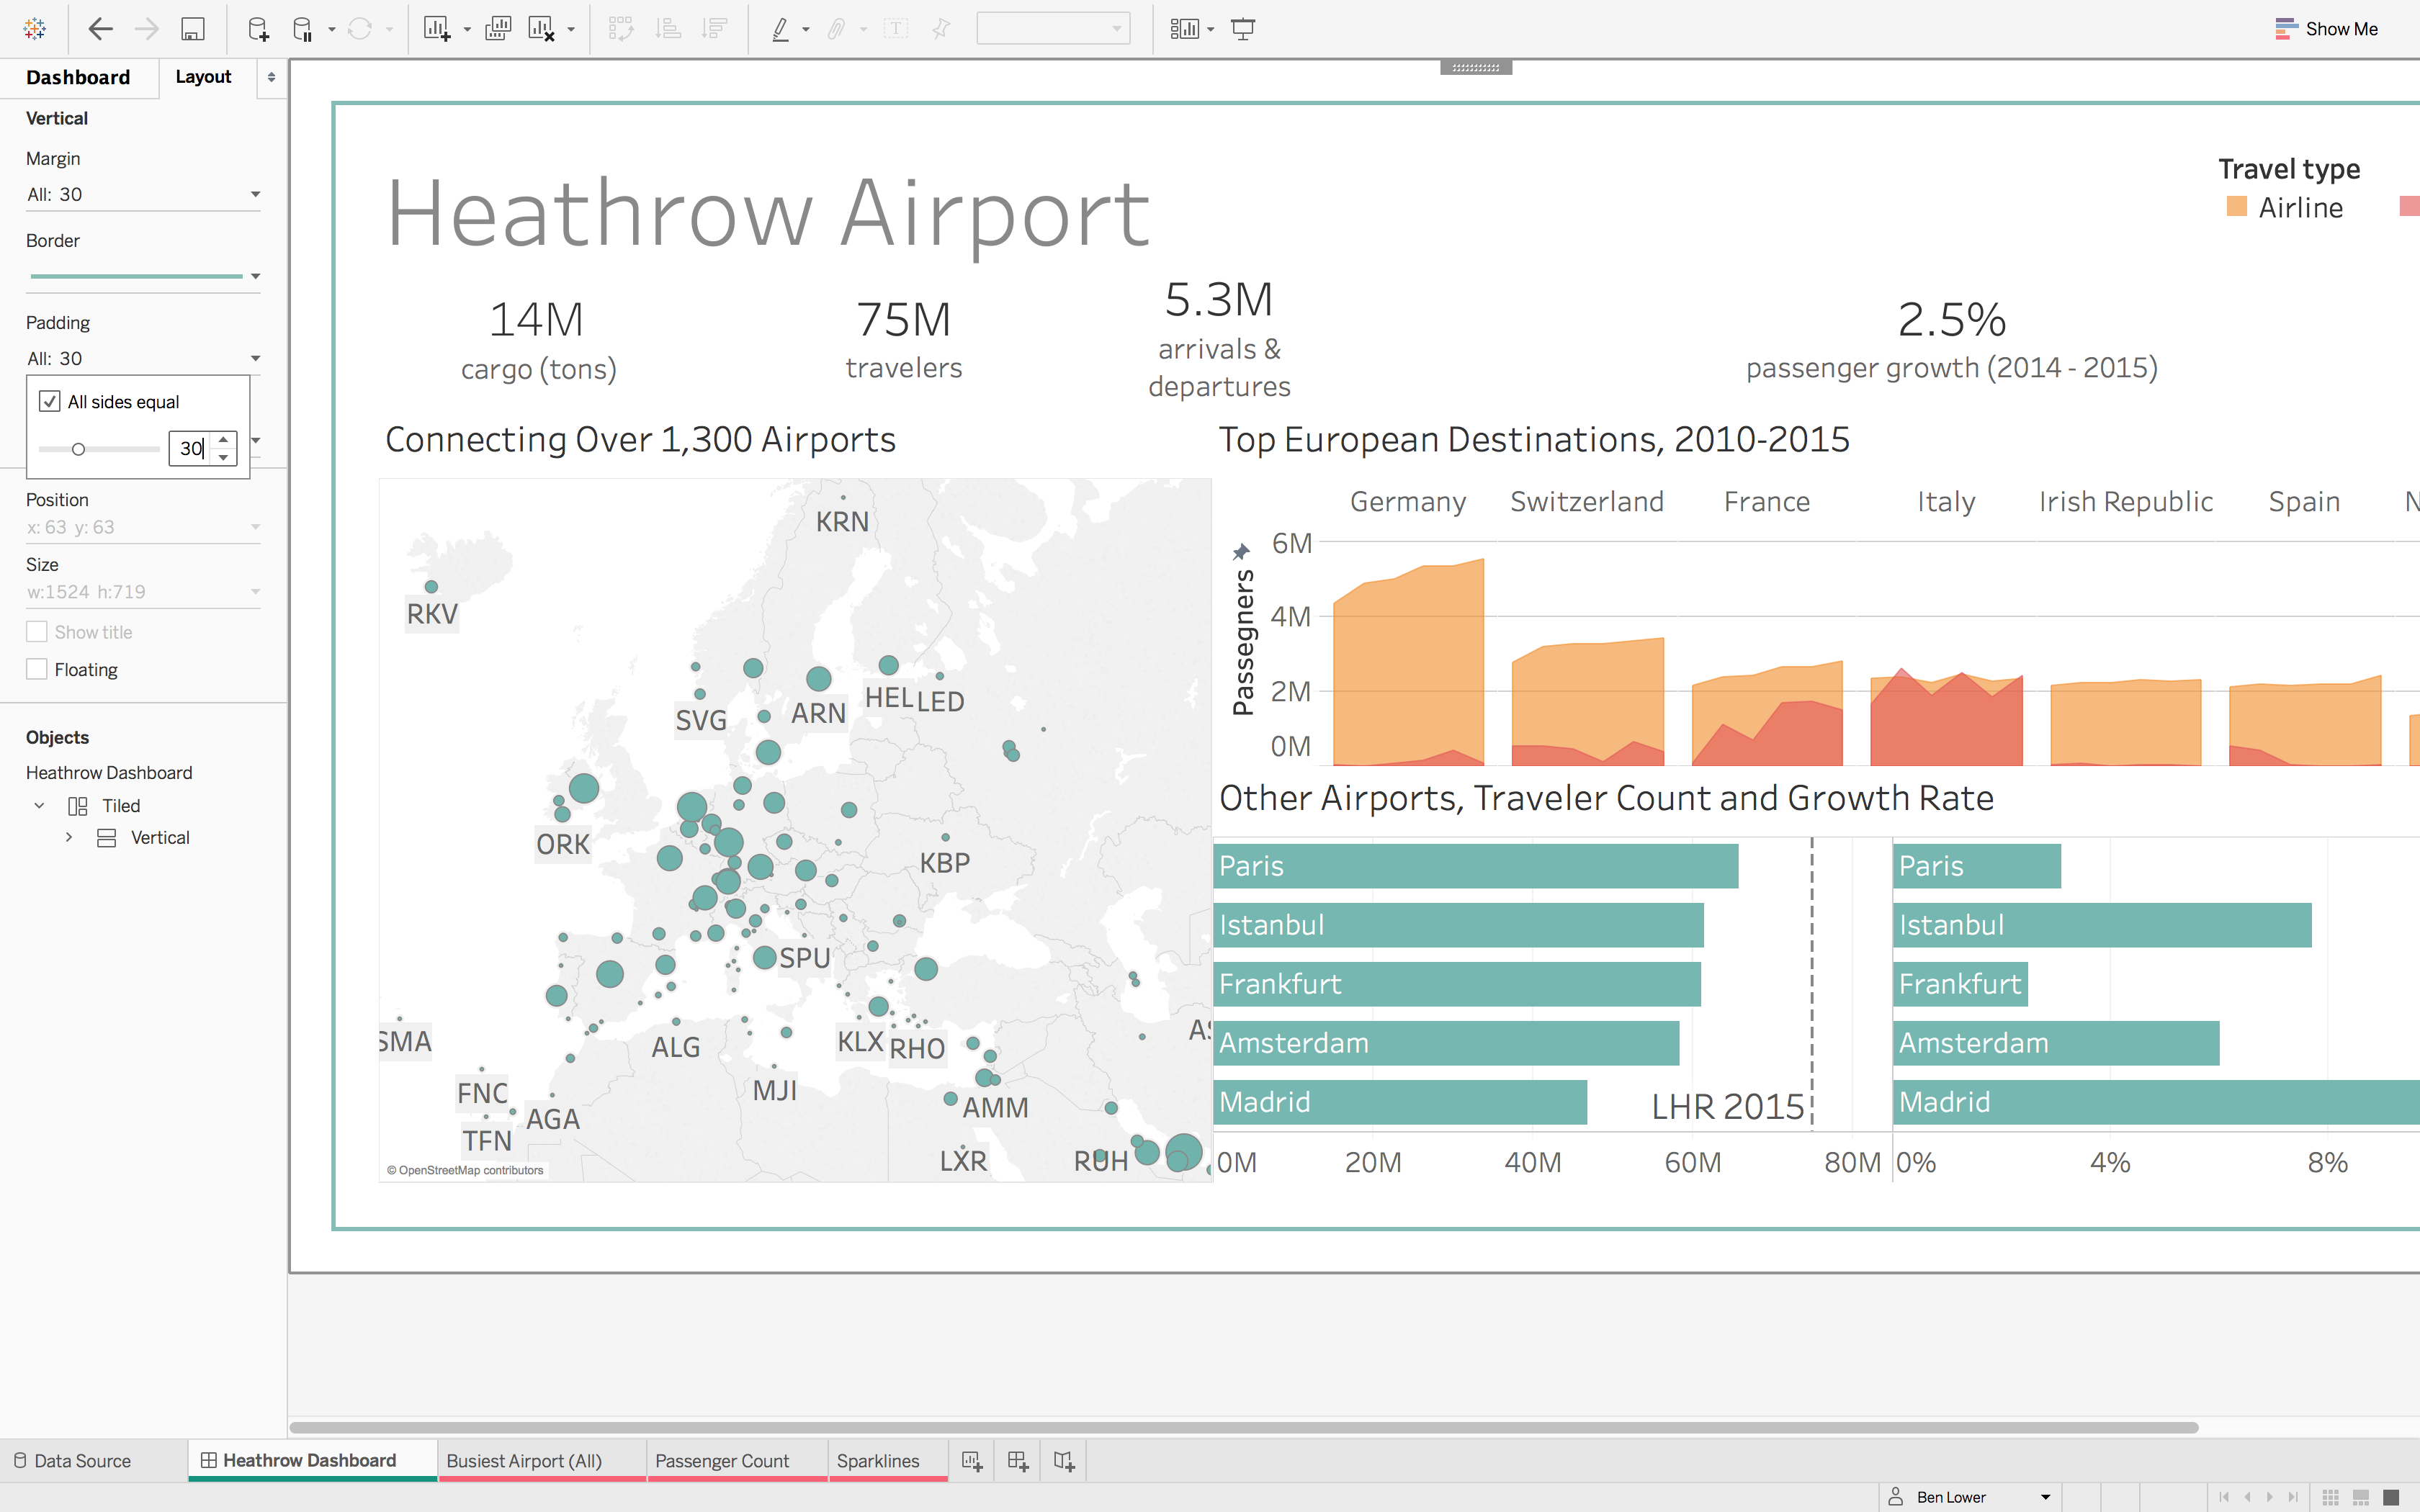
Ever feel like the objects on your dashboard aren’t balanced? You’ll soon be able to distribute the objects evenly with one click. Margins, padding, and borders are also coming soon to help you create beautiful and precise dashboards.
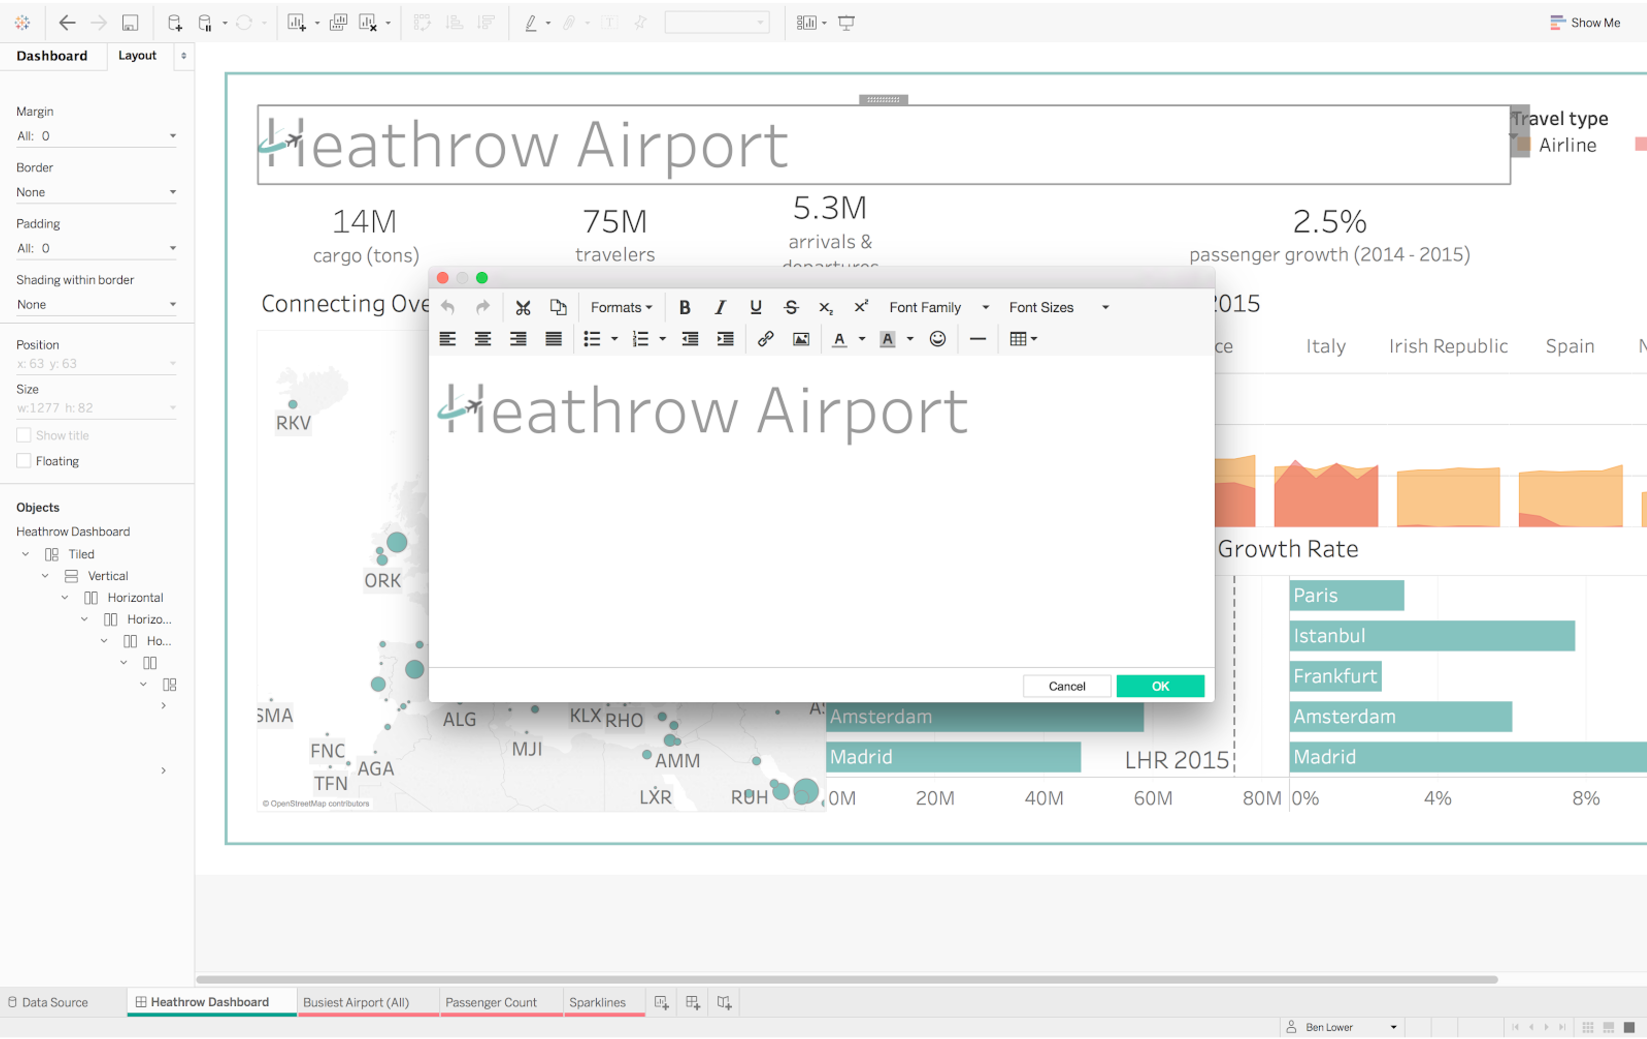
We’re also adding expressive text editing to give you more control. This feature makes it easier to add richly-styled text including logos, colors, and hyperlinks and align the look and feel of your dashboards to the rest of your brand.
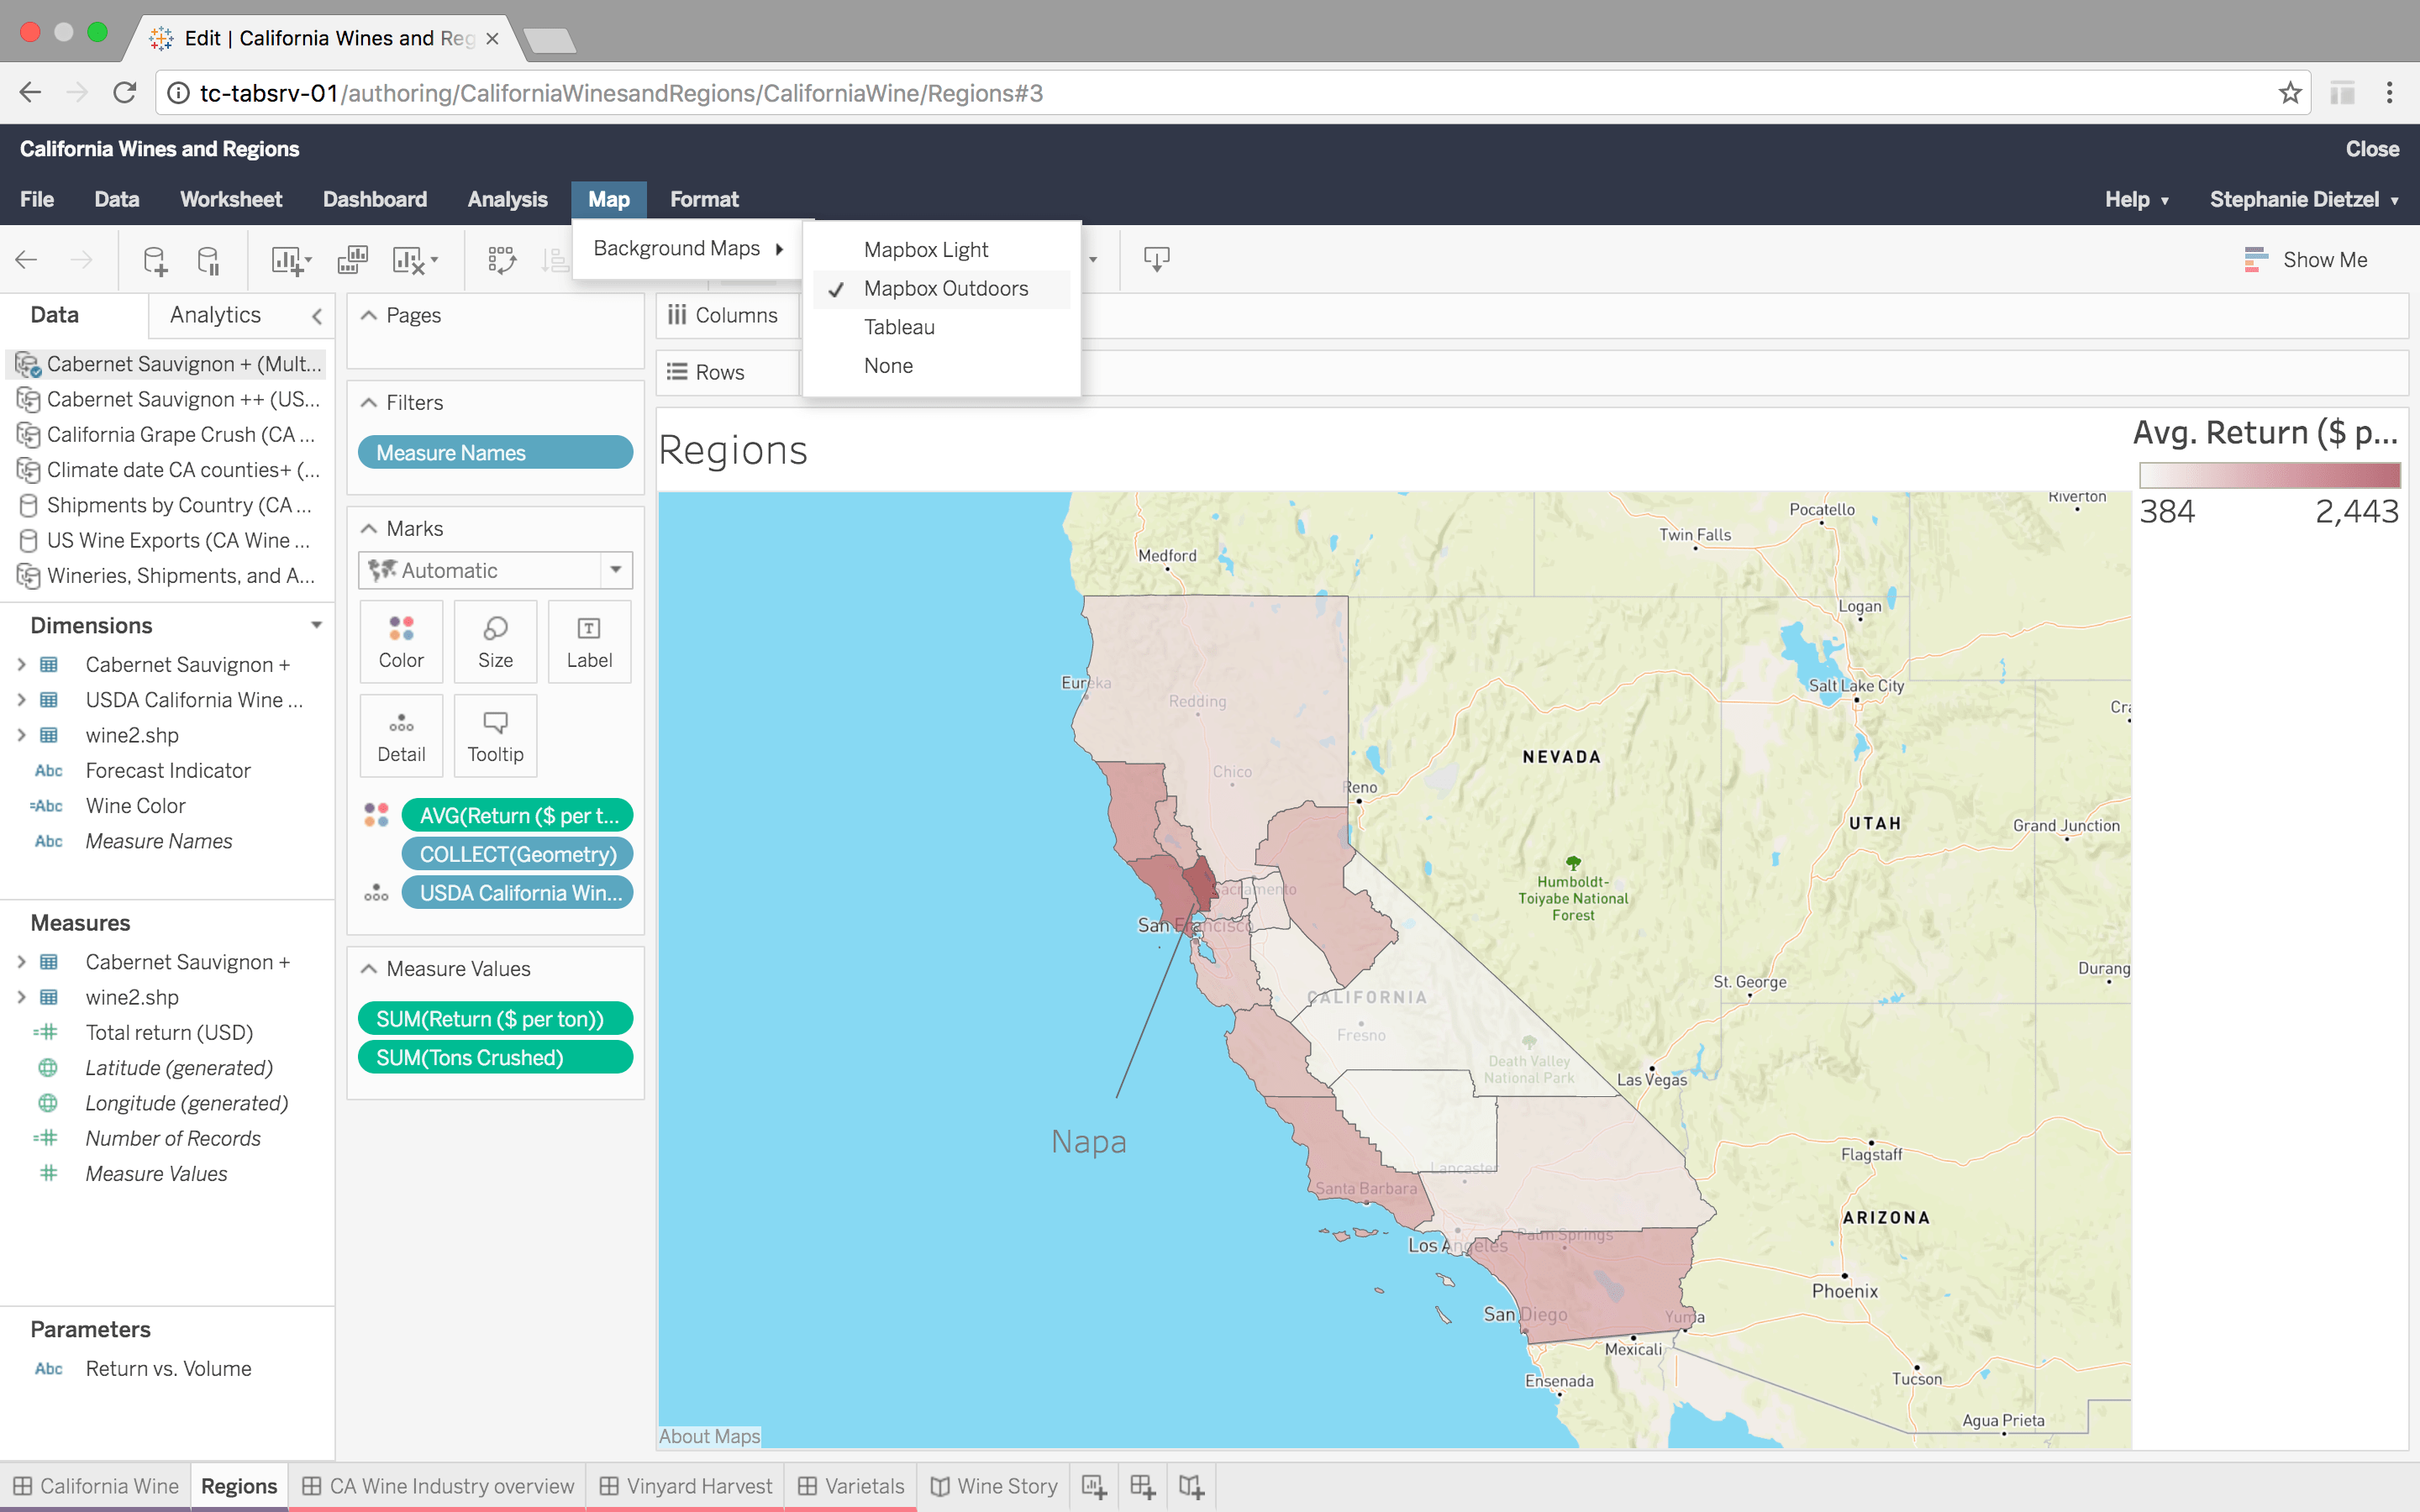
Most companies use Tableau Server and Tableau Online to enable their organization with governed self-service analytics. Enterprises often use web authoring as a part of their self-service strategy. This approach empowers people to quickly ask and answer their own questions right from the browser and create new view without needing to use Tableau Desktop.
We are continually making that browser-based experience better and more powerful. To that end, we have several capabilities planned. You’ll soon be able to: hide and resize headers, format numbers, change map styles, and aggregate or disaggregate marks. These features add up to big impact.
Easy access to data on the go
When you’re on the go, you want your vizzes at your fingertips. And our upcoming new mobile capabilities will do just that. When you get a Tableau subscription email, the embedded link will open on our mobile app, leveraging the sign-in you’ve already done.
We’re also redesigning the toolbar, adding commenting, all while giving more space to your viz.
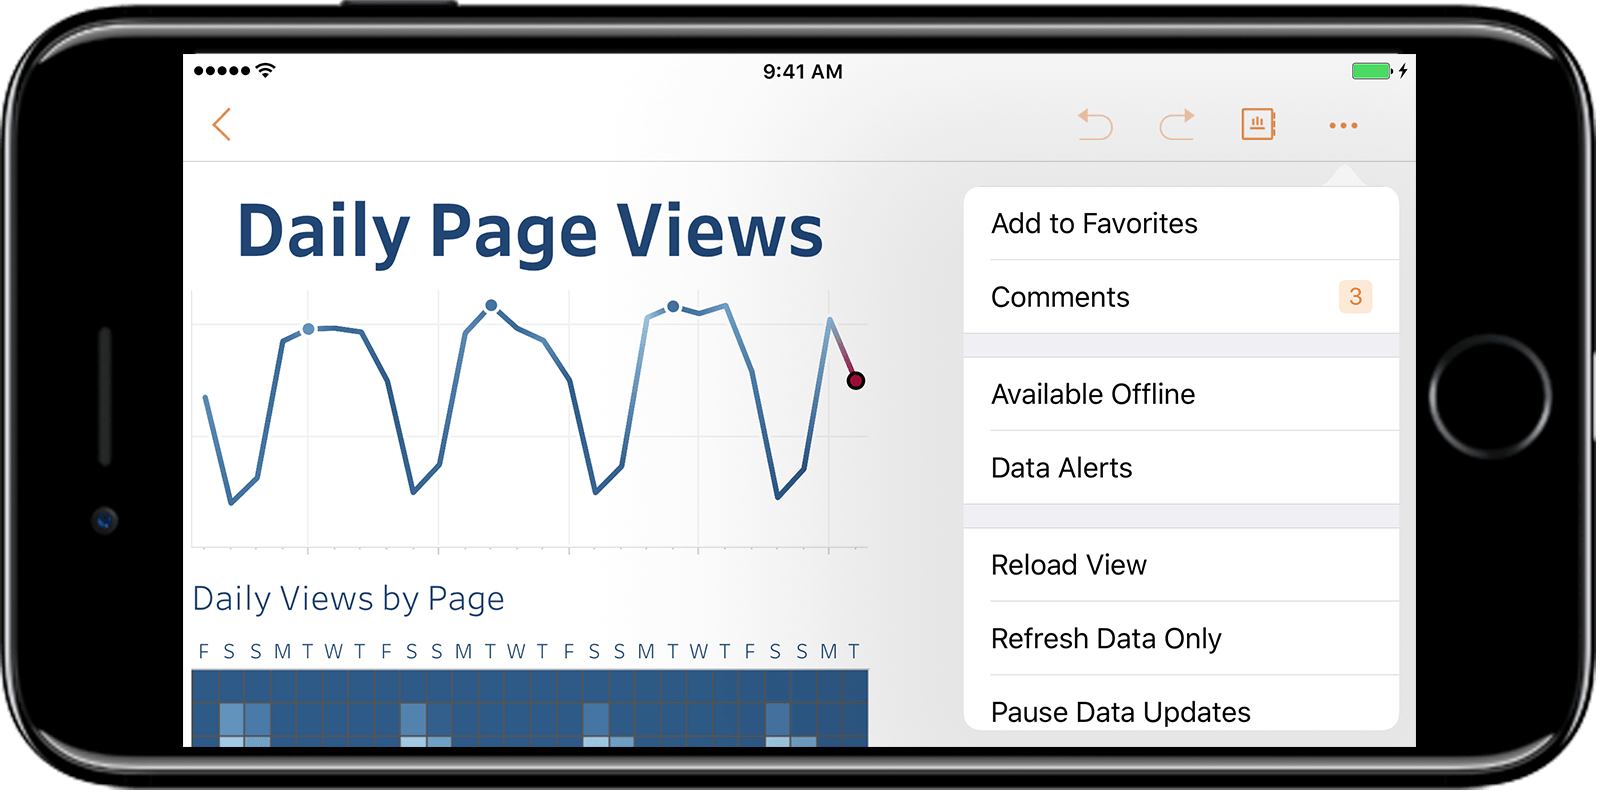
And our smooth, improved tooltips will help you reach even the smallest mark when you interact with your viz.
Also coming soon to Tableau Mobile: more offline capabilities! You’ll soon be able to scroll, use tooltip, interact with legends, and highlight data all while your phone is in airplane mode.
Faster data prep, easier data access
Of course, all the analytics magic starts with data, which is why we’re working to help you prep your data faster for analysis.
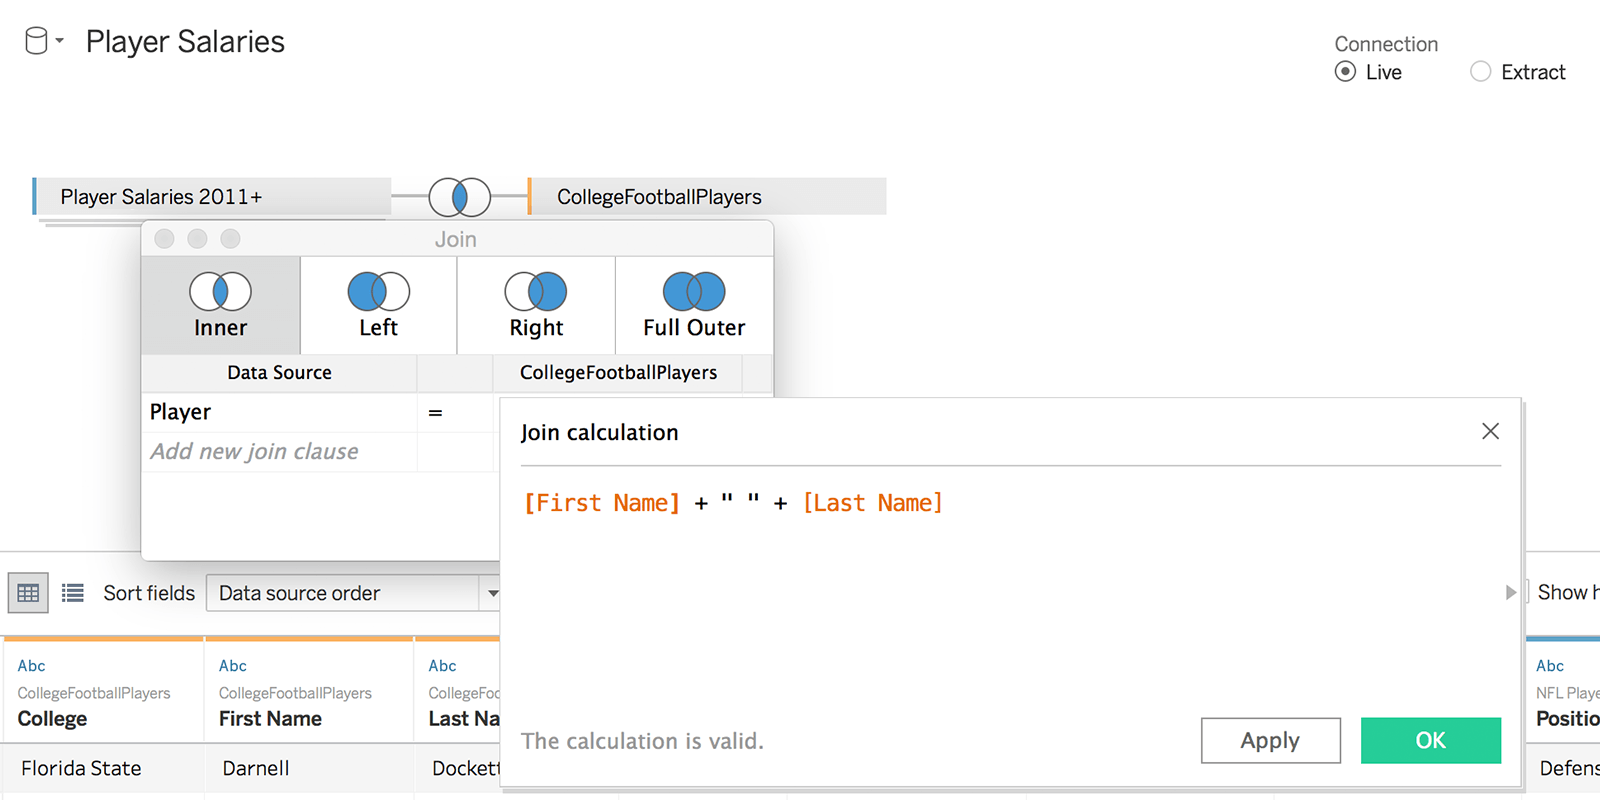
Just when you thought cross-database joins were life-changing, we’re going a step further. Got two data sets without a matching field? No problem. You’ll soon be able to join on calculation with just a few clicks! This feature works across different data sources and gives you the power to quickly join data without messing with the database.
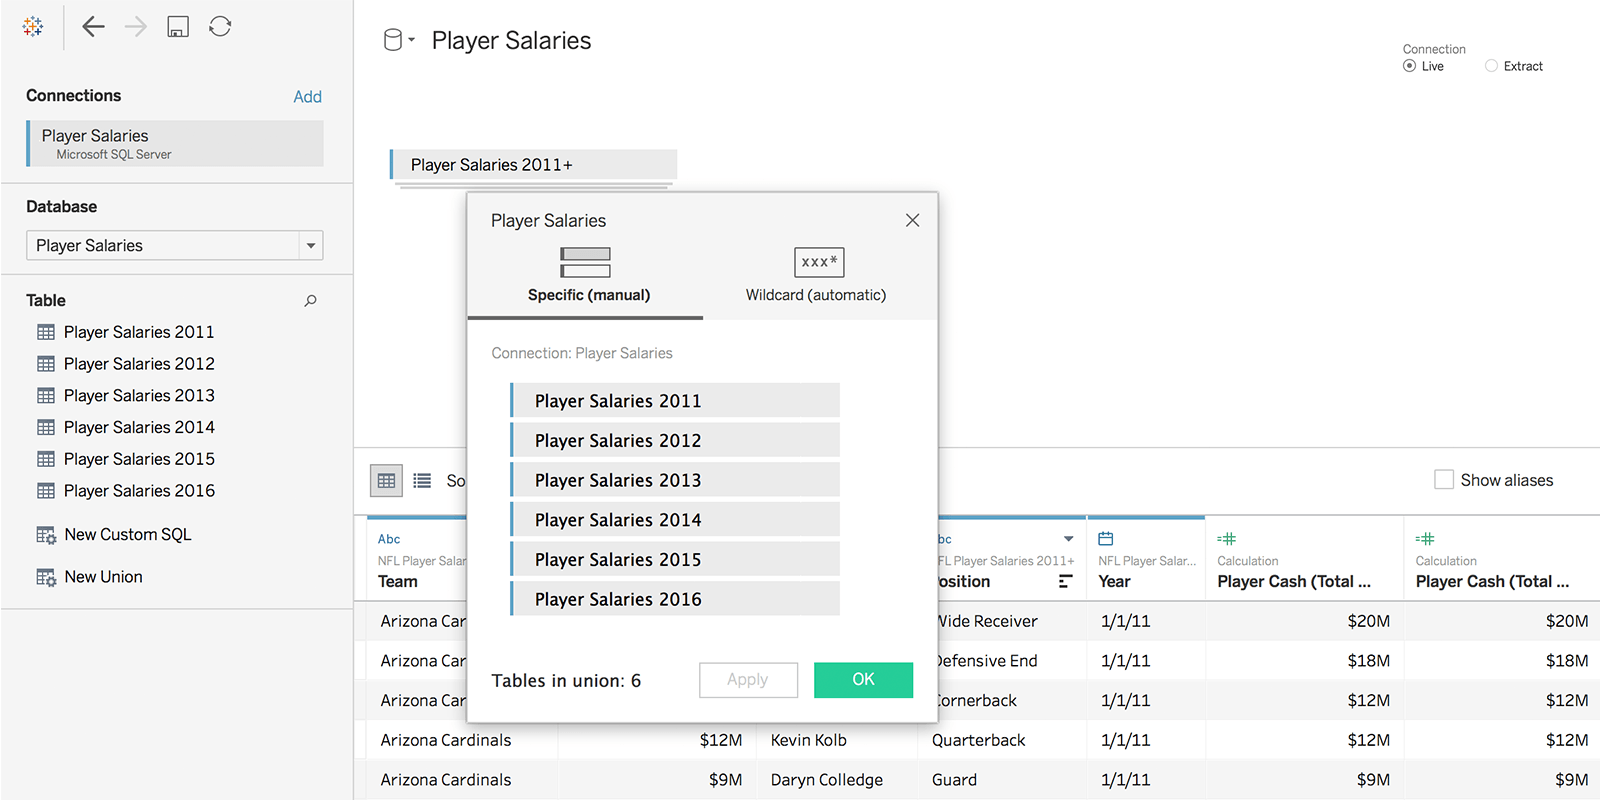
And soon, you can Union tables that live in a database with a simple drag and drop, no SQL required. That means you can analyze data spread over multiple tables without having to go to your database admin.
And to help you wrangle those large, messy PDFs, we’re working on a new PDF connector in Tableau. You’ll simply connect, and Tableau will recognize the tables.
Wider reach, less busy work with APIs
Whether you’re a dev or a business user, APIs help you cut down something none of us like: busy work. We continue to invest in Tableau’s Developer Portal so you can automate tedious tasks, write less code, and embed your Tableau content everywhere. We have a number of new capabilities you can leverage right now.
Our new server client library makes automating tasks a breeze. Our Document API eliminates the need for XML hacking. And our REST API makes custom portals fast, easy, and beautiful to create.
You’ve told us you want to have a custom mobile experience. You want to embed Tableau in your own mobile apps. That’s why we just released at TC: Mobile App Bootstrap! This will help you get started at building amazing apps that include Tableau vizzes.
The best part: All of our extensibility features, including Mobile App Bootstrap, are 100% open source and available on GitHub right now.
You ask, we listen
Each one of these capabilities were designed with business users and IT enablers in mind. We work hard so you can dive deeper into your data and have an impact. Your feedback helps us guide our work. In fact, there are more than 25 features in the works that started as your suggestions on our Ideas Forum.
So please keep your ideas coming and let us know what’s working, what needs work, and what you’d like to see in future releases of Tableau. We’re excited to see the impact you have with your data!
Note: Many of the capabilities and products discussed in this blog post are not currently available and may not be ready on time or at all. We advise customers to make their purchase decisions based upon features currently available and upgrade to the latest version of Tableau to enjoy the latest capabilities.
Historias relacionadas
Who is Einstein Copilot for Tableau for?
 10 Abril, 2024

Securely Access and Analyze All of Your Data with Data Connect for Tableau Cloud
Tableau Prep Conductor Supports Custom Schedules
 15 Marzo, 2024
Suscribirse a nuestro blog
Obtenga las últimas actualizaciones de Tableau en su bandeja de entrada.