Measuring Customer Satisfaction
Many businesses have survey data somewhere, waiting for better analysis. Using a survey containing ratings from 1 to 10, this analytical view correlates ratings of overall satisfaction, firm expertise, and likelihood to recommend for several customer segments. Each circle represents a segment defined by the combination of industry, job function, gender, and product. Size corresponds to the number of customers in that segment.

Create and share on Tableau Public
Join the newsletter and find daily inspiration with the Viz of the Day. Yours could be featured next!
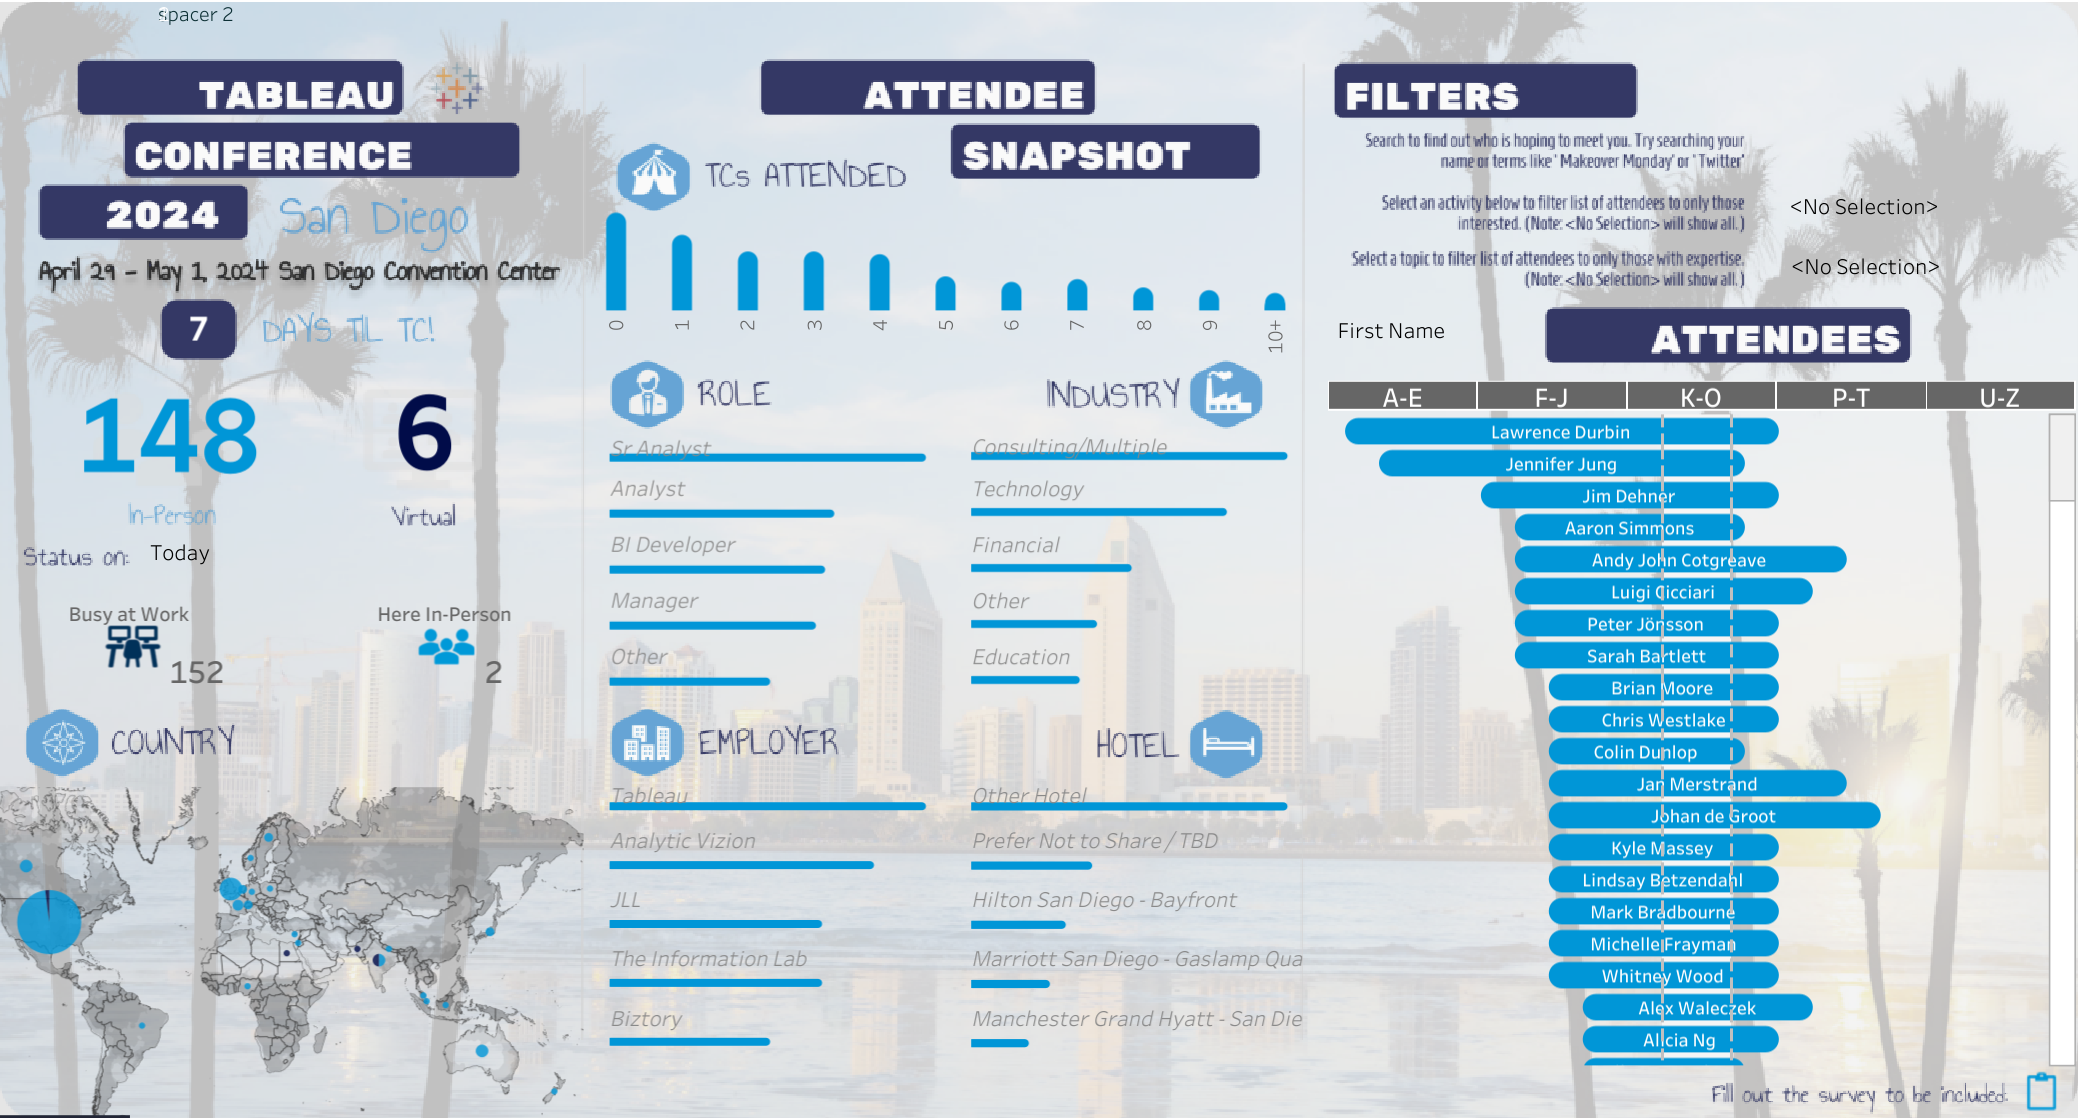
#DATA24 Who is in Town
7 days until Tableau Conference! Explore this #VizOfTheDay by Chris McClellan to see who's attending #Data24. Psst, you can even add yourself. Hope to see you in San Diego, #DataFam.
Interact with the viz