Subject Area: UI
Level of complexity: Intermediate
Approximate Time to complete: 1-2 hours
Companion Workbook (twbx): n/a
Additional Resources on the web:
- http://community.tableau.com/servlet/JiveServlet/download/228462-24108/basic_performance_tips.pdf
- http://kb.tableau.com/articles/knowledgebase/using-context-filters-improve-performance
When working with big data in Tableau, it's important to be aware of how to effectively pre-filter your data to ensure a faster end-user experience. Common issues with big data include:
- Determining whether to connect live to an underlying database or use Tableau's in-memory data engine
- Too much underlying data that aren't necessary, causing long load times
- Complex custom SQL joins can cause long load times
- Too much data in a view can cause long load times and isn't visual best practices
- Too much data with high cardinality can cause long wait times when using specific tools and calculations in Tableau (e.g., string calculations and Tableau's sets)
This guide serves as a general recommendations guide concerning the above points.
Determining whether to connect live to an underlying database or to use Tableau's in-memory data engine
When connecting to data you may choose to connect live directly to your database or to extract the data into Tableau's in-memory data engine. Below are the positives and negatives of each:
Connecting Live
- Leverage your investment in your high performance database(s).
- Have the latest data appear when you open a dashboard in Tableau.
- Delivers a slower experience with most databases
Extracting Data
- Designed to handle roughly 300-500 million rows of data, though many customers have much larger extracts
- Very fast columnar data engine designed for fast read speeds and much faster than many databases
- Minimizes queries made directly to your database
- Can be extracted on a scheduled basis as often as every fifteen minutes with Tableau Server
Most of the time, customers prefer to extract their data into Tableau's fast data engine. It is typically many times faster than their databases, often returning visualizations in significantly less time than with a typical live connection to a database. With Tableau Server, you can schedule your extracts to be refreshed (either fully or incrementally) as often as every fifteen minutes.
If you have billions of rows of data, you may still consider extracting the data into Tableau's data engine. Though Tableau's data engine was designed to work well for 300 – 500 million rows of data, many customers have had success extracting multi-billion row datasets and having exceptional performance. Alternatively, if you have a database specifically designed for fast read speeds (e.g., cubes, a lot of hardware, Hp Vertica, Sybase IQ, Amazon Redshift et al.,) you may choose to connect live to leverage your investment in these technologies.
Oftentimes, it is not necessary to connect to all 5B+ rows of data in your database. Pre-aggregating data, filtering unnecessary rows, and removing unnecessary fields can improve your experience in both speed and data consumption.
When connecting live:
- Avoid using Tableau's custom SQL dialogue.
- Instead, either extract your data, or create a view of your data. This will help optimize the queries and improve read speeds.
- Pre-aggregate the data to a higher dimension. For instance, you may choose to roll up the data to a customer name, month, week, or a day level, or specific locations rather than use the row-level data. This can help to drastically reduce the data size and improve the end user's consumption experience.
- It's also important to identify which fields are critical for ~90% of all major analyses and use cases, and to remove the fields that have few use cases or are redundant. Limiting the number of fields to under thirty will help report builders easily navigate the data and construct analyses, without getting lost having to navigate through scores or hundreds of field names that are often irrelevant to most analyses.
- Instead of having one large data connection, consider breaking the data down into various data connections that address specific general types of business questions you want your report creators to answer. This allows for better usability and analyses.
When extracting data:
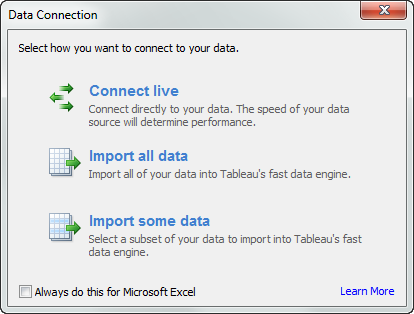
- First, simply choose to connect live to your data.
- Then, right-click on your field names in the dimensions and measures shelf and hide all unnecessary fields so that you have the core twenty to thirty critical fields that are needed to answer the core business questions. This will help reduce the amount of data your end user will have to sift through. Fields with low granularity (e.g., row ID's) can be removed here, which will help us roll the data up to a higher granularity.
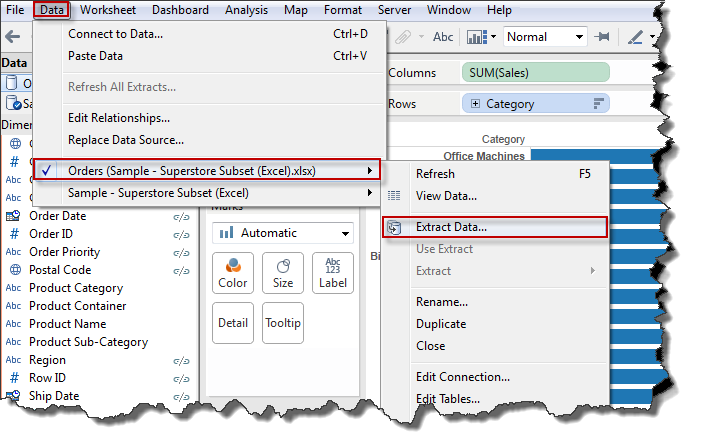
- After doing this, we will want to extract our data.
- To extract the data, click on Data> [Your Data Source Name] > Extract Data
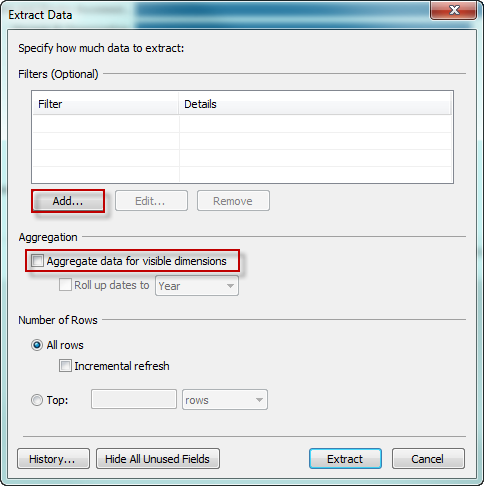
From here, choose to add various filters to limit the data to what you need (e.g., you may not need certain time ranges, a certain region or product in your analyses). Next, choose to aggregate your data for visible dimensions (to roll up the data to a level of granularity based on what you hid in the previous step).
With the above basic pre-filtering approaches, your data will become more manageable from an end-user perspective in both ease of use and performance.