Subject Area: Architecture
Level of complexity: Intermediate
Approximate Time to complete: 1 hour
Companion Workbook (twbx): DataBlendingScenarioColumn.twbx
Additional Resources on the web:
- http://www.tableau.com/learn/tutorials/on-demand/data-blending-0
- http://tcc13.tableauconference.com/sites/default/files/materials/TCC%202013%20Joins%20and%20Blends%20Guided%20PDF.pdf
- http://onlinehelp.tableau.com/current/pro/online/en-us/help.htm#multipleconnections_understanding.html?Highlight=data blending
- http://onlinehelp.tableau.com/current/pro/online/en-us/help.htm#multipleconnections_troubleshooting.html?Highlight=data blending
Scenario Column analysis is a method of comparing actuals to quota. The scenario usually involves a detailed data set of sales data with individual dates for each sale and a second data set with far less detail that contains quota data. There are some key requirements to keep in mind when blending this type of data. Because the date fields will be a key feature in linking these two data sets, it is best practice to include the exact dates in the quota data set rather than just "Q2 quota" or some other customized field.
Why? If your quota is based on custom quarters that do not overlap exactly with the quarters that tableau uses the expected versus actuals will be incorrect. Another incorrect way of storing the data would be as "week 1 – quota". There would be no way of matching "week 1 quota" to the dates from your sales data. So, the best practice is to include the exact date that a quota is set for.
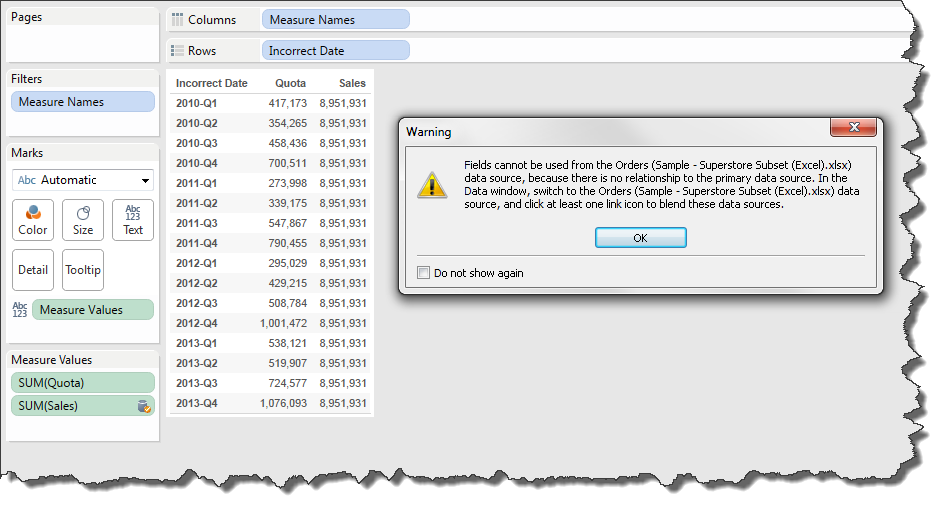
In the workbook provided there are two data sources. One contains quota data and one contains sales data. The quota has a correct date to use and an incorrect date to use. First try make a view that shows quota versus actuals with the incorrect date field. You will quickly find that there is no way to link the sales data to the quota data.
Now try again using the correct date. Drag the correct date out to the view and drill down to the quarter level. It is now possible to blend the correct date with the Order Date from the sales data. With this blend in action actual sales and quota can be compared. However, we must be weary of the level of aggregation that we blend the dates. The quotas are set to a single day that represents the end of a quarter. If we create a full blend on the date fields than the sales we will be comparing an entire quarter worth of quota with a single day worth of sales data. Instead of using a full blend with the dates, only create the relationship for year and quarter. This will aggregate the sales data to the quarterly level when comparing it with quota. It is crucial to blend the data to the level of detail expected of the quotas. If weekly quotas were set than the relationship would need to be set all the way down to the level of weeks.
When working with customized quotas that do not follow the same weekly/quarterly formats as tableau a calculation will likely be necessary to match your sales data dates with quota dates. In this case it can be helpful to have a second date field in the quota data set that denotes the beginning date of a quarter. These fields can be used as logic statements to join the quota and sales data at the proper time frames.