A Checklist for Delivering Effective Presentations with Data


Note: The following is a guest post by Dr. Kristen Sosulski, professor of Information, Operations and Management Sciences at NYU Stern School of Business.
Preparing a presentation with data? Consider using your data to tell a story.
Storytelling with data is much more powerful than creating a PowerPoint deck with talking points.
My students often take this latter approach when asked to deliver project presentations, but this method tends to fall short. Here are some of the most common pitfalls:
- Visualizations shown in the slides were not referenced: The presenter talked over their charts and graphs without making explicit references to them.
- No story or narrative: The presentation was primarily informational and delivered as a report.
- Lack of audience engagement: The presenters did not include opportunities for audience interaction, questions, or dialogue.
- Little or no audience eye contact: Presenters looked past the audience or down at their notes instead of engaging with their addressees.
- Over the time limit: The presenters did not complete their presentation within the time allotted.
- Too much information: The presenters provided too much information on their slides. The guideline is six words per line, and no more than six lines of text.
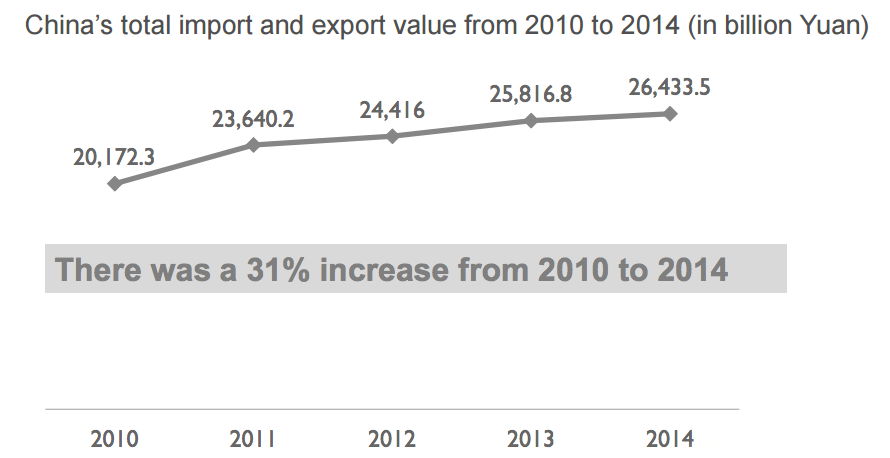
I try to help students prepare by explaining the key elements required for an effective data presentation. Best practices include identifying the takeaway, contextualizing the findings, and presenting the key numbers. (Check out this webinar for more details on best practices.) Here's a great example of this focused approach:
To help my students avoid pitfalls, I provide a detailed rubric that lists the standards of assessment. (You can download the full rubric here.)
The criteria is based on these five questions:
1. Did the team select an interesting story to tell with the data as it related to the topic and audience?
A story should have a clear beginning, middle, and end. Questions are useful to guide the audience with answers as are takeaways that drive the narrative from introduction to conclusion.
2. Did the team select appropriate visualizations (chart types) to present the data?
Charts and graphs should clearly show the data without bias. The chart type should be familiar to the audience. Avoid overly-complex charts that look fancy but don't clearly show insights.
3. Did the team apply effective design principles to the charts to clearly present the data?
Charts should be devoid of extraneous non-data elements such as shadows, borders, and use of color for decoration.
4. Did the team apply effective design principles to the presentation?
Presentation decks should be designed to support the presentation rather than be the presentation. Text should be limited and the use of visuals should be emphasized. All text should be readable (at least 36-point font) for the audience.
5. Did the group present visualizations that worked together to tell a coherent story?
The visualizations used should progressively reveal the insights or trends. Each visualization should highlight a single and different takeaway.
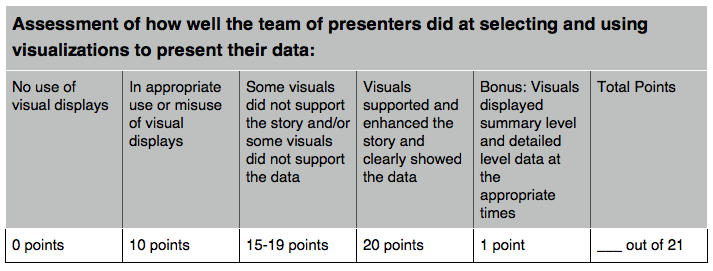
I evaluate each question on a 20-point scale. If students meet the expectations, they earn full credit, which in this case is 20 points. There is a bonus category that encourages students to go above and beyond the expectation, and it is worth one additional point.
Here’s an example that shows how I assess students on their selection and use of data visualizations. With this rubric to help them prepare, students can strive to exceed expectations while applying the recommendations included in the bonus category for extra points.
This may be a rubric for students, but it can prove useful for anyone presenting their data findings. Use the rubric as a checklist to help craft effective data presentations. And share your findings in a way that keeps your audience engaged and listening.
For more tips on showing insights and telling data-driven stories, check out Kristen's recent webinar.
Meet the Author
Dr. Kristen Sosulski develops innovative practices for higher education as the Director of Education for the NYU Stern W.R. Berkley Innovation Lab. She also teaches MBA students and executive data visualization, R programming, and operations management as an Associate Professor at NYU’s Stern School of Business.
As a leading expert on data visualization, Kristen regularly consults, delivers seminars, and leads workshops on data visualization techniques and best practices. You can find her speaking on the subject at events like Social Media Week NYC and to organizations like the National Association of Pubic Opinion, Digital Analytics Association, and the National Economic Research Associates.
Follow Kristen on Twitter at @sosulski, connect with her on LinkedIn, and learn more at kristensosulski.com.
Blog abonnieren
Rufen Sie die neuesten Tableau-Updates in Ihrem Posteingang ab.