To become a data-viz artist, embrace the art of iterating


Note: The following is a guest post by Tableau enthusiast David Pires.
Google “iteration” and this is what you’ll get:
“Iteration is the act of repeating a process, either to generate an unbounded sequence of outcomes, or with the aim of approaching a desired goal, target, or result. Each repetition of the process is also called an 'iteration,' and the results of one iteration are used as the starting point for the next iteration.”
I used to think iterating was overrated, always striving to produce the goods as soon as possible with as few tries as possible. That was until I started to participate in Makeover Monday, an initiative run by Andy Kriebel and Andy Cotgreave.
They find a visualisation online and post it on Sunday with the companion data set. The task is to find a better way to visualise that data. That can mean a more engaging visualisation, or perhaps a chart that is easier to understand.
My own approach is to allow for some off-the-wall ideas and sometimes downright less-than-decent visualisations. But I allow myself that because it makes me better at my job. To me, Makeover Monday is my playground, my practice gym.
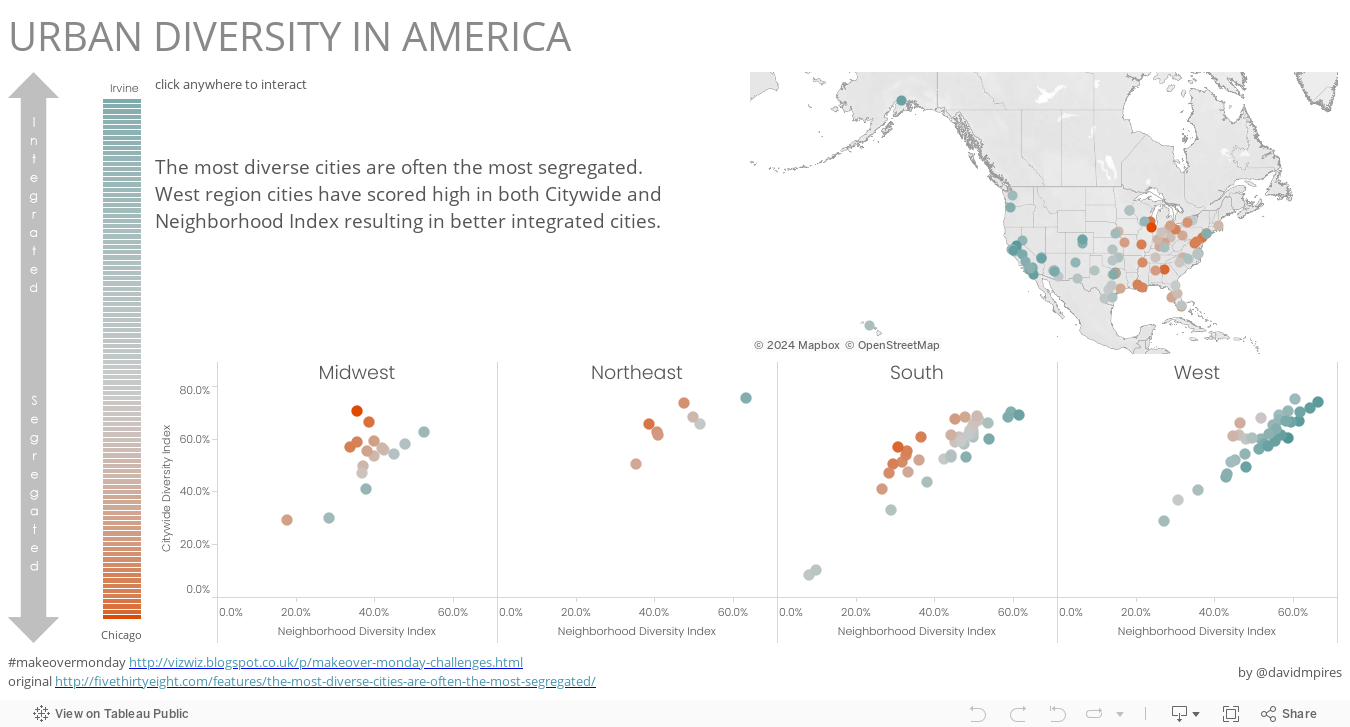
Here's one of my Makeover Monday vizzes.
But back to the topic of iteration. Often we see visualisations that are beautiful to look at or tell a great story. And for those just starting their data-viz journey, it’s easy to get demoralised and think,“I’ll never be this good.”
However, what you don’t see is the work behind the pretty picture—the frustrations and the countless drafts that end up in the bin. I started to notice a pattern in my own process and my own state of mind.
Here’s what that looks like:
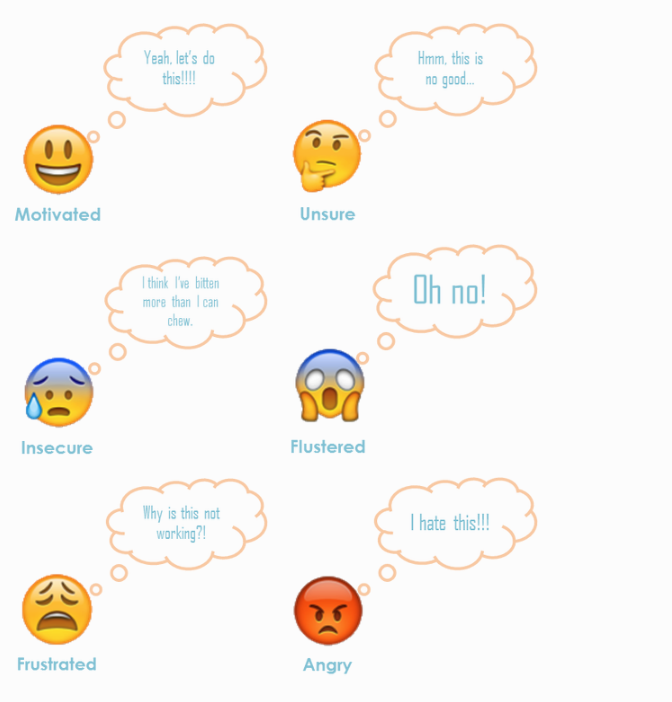
At this point, it’s good to take a break from it. Stepping back is very much underrated. It can often provide you with the clarity you need.
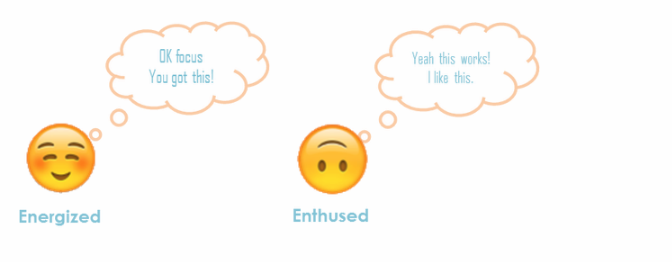
Luckily, the process usually ends with me being proud of the work produced and publishing it.
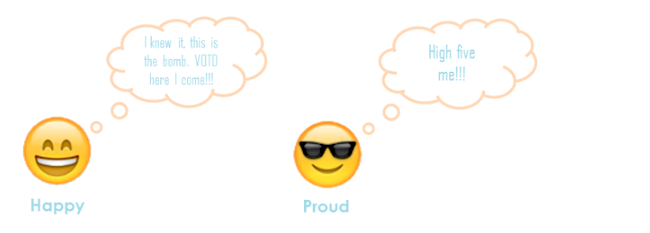
I’d say that most content creators go through these steps on a regular basis. Nevertheless, with practice, you learn to manage your emotions better, and the time between each stage decreases. The only way to get good at it is to practice and practice, and practice some more.
For example, I’ve received compliments on my choice of colours. But that’s because I’ve been relentlessly looking at colour palettes for the past two years, and I try a bunch of colour combinations before I decide on the final one. I also grab inspiration from anything I can get: Google, adverts, fashion—anything, really.
So the next time you start working on a project that is not going the way you expect, keep this in mind. Remember that sometimes you have to go through multiple iterations until you find something that you are happy with. And sometimes you go full-circle and find out that your first idea was the best one after all, even if seemed pretty simple initially.
For more tips, ideas, and vizzes by David, check out his Tableau Public page and his blog, ivisualize.co.uk. You can also connect with him on Twitter @davidmpires.
Zugehörige Storys

Visualizing Women's Impact to History Through Data Visualization
 18 März, 2024

Behind the Viz: Adrian Zinovei Helps You Design Your Next Dashboard
1 März, 2024

Charting the Heart: Data Visualizations on Love
 14 Februar, 2024
Blog abonnieren
Rufen Sie die neuesten Tableau-Updates in Ihrem Posteingang ab.