Best of the Tableau Web: February 2013
February was short, but it didn't stop our community producing lots of great content. Here is the collection of what's been happening on the web in the last month.
February was short, but it didn't stop our community producing lots of great content. Here is the collection of what's been happening on the web in the last month.
Drawing with Numbers - Eddie Van Halen and Dashed Lines - Tableau tricks
Drawing with Numbers - Learning something new every day: Annotating Subtotals - Tableau tricks
Drawing with Numbers - Unexpected Results: Aliases in URL Parameters - Tableau tips
Drawing With Numbers - A Virtual Orrery in Tableau - Tableau tricks
The Information Lab - Google Chrome Extension for Tableau Server - Tableau applications
VizWiz - Taking the Kraken to U.S. federal government spending - Tableau makeover
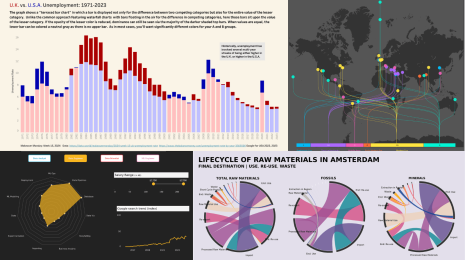
VizWiz - Improving the WSJ Historical U.S. Unemployment Rates heat map - Tableau makeover
VizWiz - Embedding dashboards from multiple, disparate workbooks into a single workbook - Tableau tips
VizWiz - Pie charts duel to their death: Create slope graphs as an alternative in Tableau in five steps - Tableau tips
Health Intelligence - An implementation of Stephen Few's bandlines - Tableau tricks
Tableau Friction - Tv8 Dashboard Quick Filters - Great, Flawed - Tableau tips
Interworks - Musings on Tableau Custom SQL connections through the JET driver - Tableau tips
See Change - Setting up SAS dates for input into Tableau Desktop - Tableau tips
They walked together - a look at the pros and cons of Tables v Charts - Tableau tips
Concentra - The Horsemeat Scandal: where did it come from and where does it usually go? - Tableau use case
Aspie Econ - On being a Data Scientist-- How to analyze a Petabyte of data on a laptop (The Samson Axiom) - Tableau tips
Jen Underwood - How To Visually Analyze R Predictive Models in Tableau - Tableau tricks
Follow me on Twitter (@acotgreave) if you want to hear about these posts as they are published. Until next month, get blogging!
Zugehörige Storys
Blog abonnieren
Rufen Sie die neuesten Tableau-Updates in Ihrem Posteingang ab.


