Gamers Find a Secret Weapon


Death and kill heat maps? Who would need such a thing? A game designer would, and Sean Houghton at High Moon Studios used death/kill data in a Tableau heat map to understand how players use the map and uncover secret strategies to beat their friends/ enemies:

"We can see the centers of the hallways are much safer than the large, open areas in the center of the map,” says Sean. Read their blog for secrets of using heatmaps and the strategies they yield for gamers.
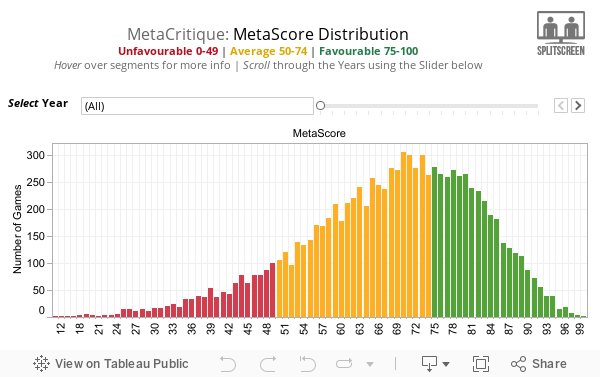
Sean’s not the only one. A recent post in SplitScreen showed a visual analysis of game reviews:
In fact, gaming companies have been coming out of the dungeon and sprouting up like blueberries around Tableau. Zynga uses Tableau to analyze massive data about user behavior in Farmville, Cityville, and a host of other games. Playdom uses Tableau to understand upsell and cross-sell in their games, as well as player behavior (find a video here). Other studios from large to small, many of which we can’t name here, are picking up Tableau faster than a druid can pick up a new Wraith Spear.
It’s no surprise why. Online games can collect data about every interaction a player has and every move they make. Add up thousands or millions of players, and suddenly you’re generating terabytes of data-- Playdom says they collect about two terabytes a day. That data is a massive competitive asset if you can use it to understand player behavior, improve your games and ultimately drive more revenue from games. But not many tools can deal with that volume of data. Tableau can.
So welcome gamers, with your strange visualizations of balance and flow maps, player viruses and weapon strengths. Let’s play!
Blog abonnieren
Rufen Sie die neuesten Tableau-Updates in Ihrem Posteingang ab.