How these students went from zero to data-viz hero in weeks


Over 150 students gathered in Singapore for a fierce data-viz competition, determined to win the top spot and proud bragging rights. To emerge victorious, they’d have to tell the best data story using Tableau. But there was a catch: None of the teams had ever used Tableau.
But that didn’t faze the secondary-school and junior-college students who entered the National Infocomm Competition (NIC) Face-off | Data Analytics Competition. The event, hosted in partnership with the Infocomm Media Development Authority (IMDA), recently came to an exciting close.
The action began back in June when students formed teams of three to put their best viz forward. After two hands-on workshops hosted by Tableau, the teams were ready to hit the ground running. They charged forward, dragging and dropping, and looking for hidden insights in the data set of their choice.
“These students were creative and curious; they weren’t afraid of making mistakes,” says Tableau’s own KJ Kim who led one of the workshop sessions. “I feel like they really grasped that with Tableau, there is no right or wrong; it’s all about, ‘Does this answer your question?’”
The first round brought in more than 50 submissions which were narrowed down to the top five teams in two grade-level categories. Those top 10 teams then proceeded to the real deal: the coveted final round. Who would clinch the title? The pressure was on.
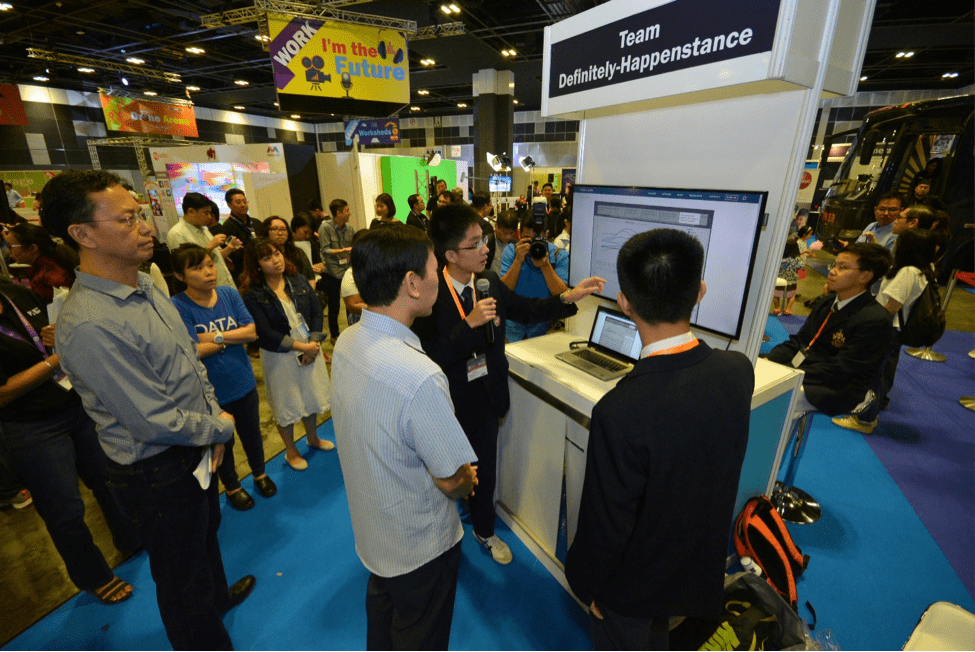
Over 10,000 people attended the event to see four judges—Tableau experts and IMDA representatives—take a close look at the vizzes. The teams were judged on three main criteria: overall practicality and relevance, strength of their data story, and dashboard design. And the judges faced a tough task, having to choose from a pool of outstanding vizzes.
“Some of the work was at a level I would expect from adults,” says judge Jonah Kim of Tableau.
The competition was fierce, but there could only be one winner in each category. Here are the two winning vizzes that stood out above the rest.
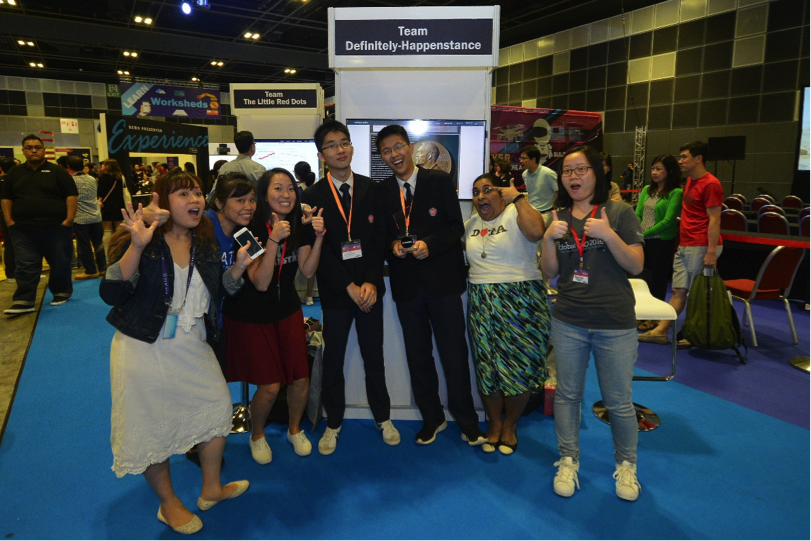
Secondary School: Team Definitely Happenstance

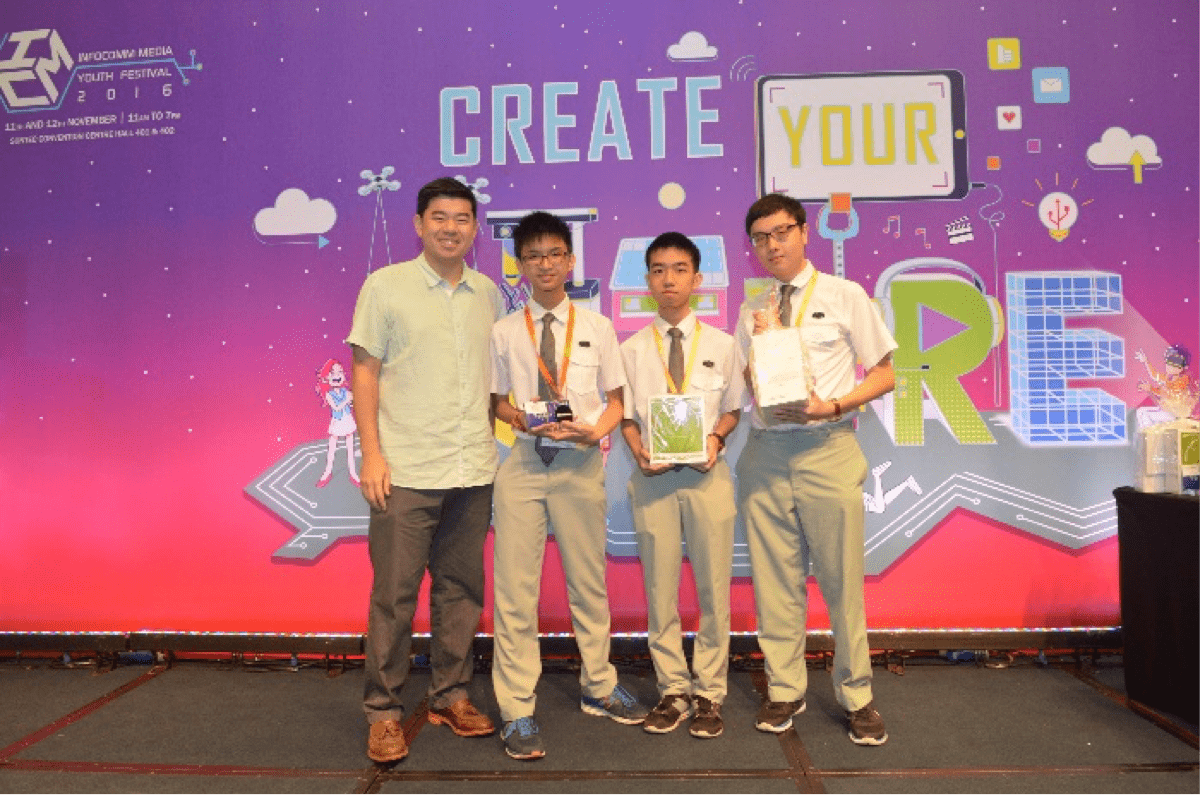
Team Definitely Happenstance from Dunman High School won the secondary-school category with a viz about the Nobel Prize. The team showed how a country’s different economic factors influences its chances of winning a Nobel Prize. The use of Story Points helps bring the viewer along each point of discovery, concluding with a prediction of Singapore’s chances of winning the award.
“When we started, we only decided on the theme, got to research some background knowledge, and that was all. Through the process of making the viz, we then started to learn about the trend (of why some countries were winning more medals),” says Chen Yiyang.
So what do you do when you win a data-viz competition? “The first thing to do is to take a photo!” says Dai Tianle.
Second order of business: defend your crown. The team is already planning to participate in the competition next year, determined to work with “bigger data” and hunt down the education data they couldn’t find this time around.
Junior College Winner: Team Vision

Team Vision from NUS High won the title in the junior college category with a viz about charity in Singapore. The viz tells the story of recent donation and volunteer trends, and how Singapore compares with the rest of the world (the viz even factors in happiness!).
“We let curiosity drive our exploration, finally picking out the most convincing and interesting insights to present in our viz,” says team member Choo Yi Kai.
The team won the chance to visit Tableau’s Singapore office where a Tableau consultant provided feedback on their viz and showed them some dashboard tips and tricks.
When asked how they will spend the prize money (a whopping $5,000 in SGD), the team members happily responded that they’d donate it to charity.
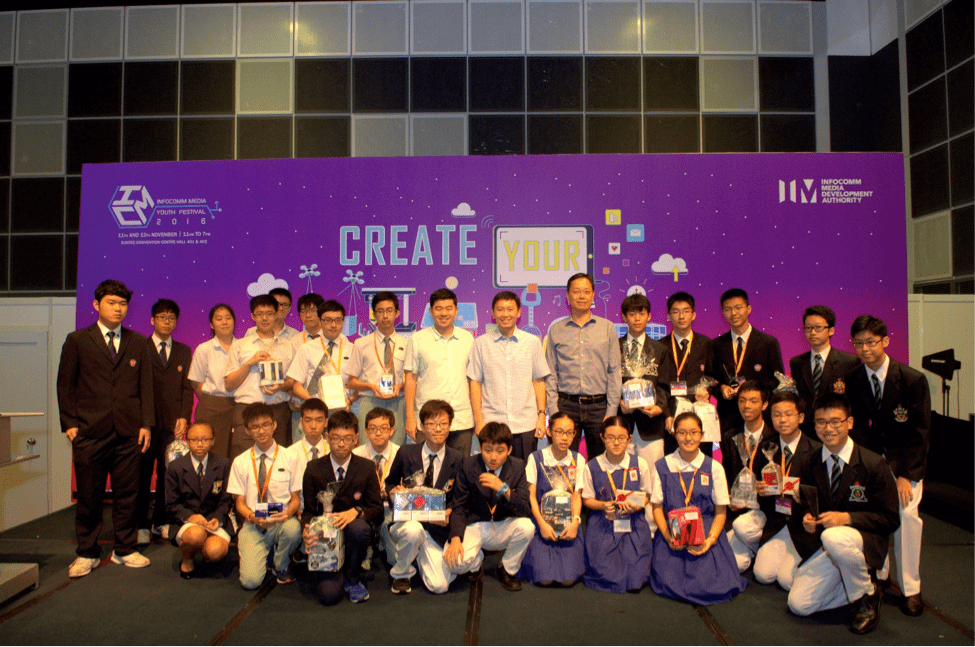
The winners were honored in a festive awards ceremony. You can bet it was a day full of cheers and proud photos.
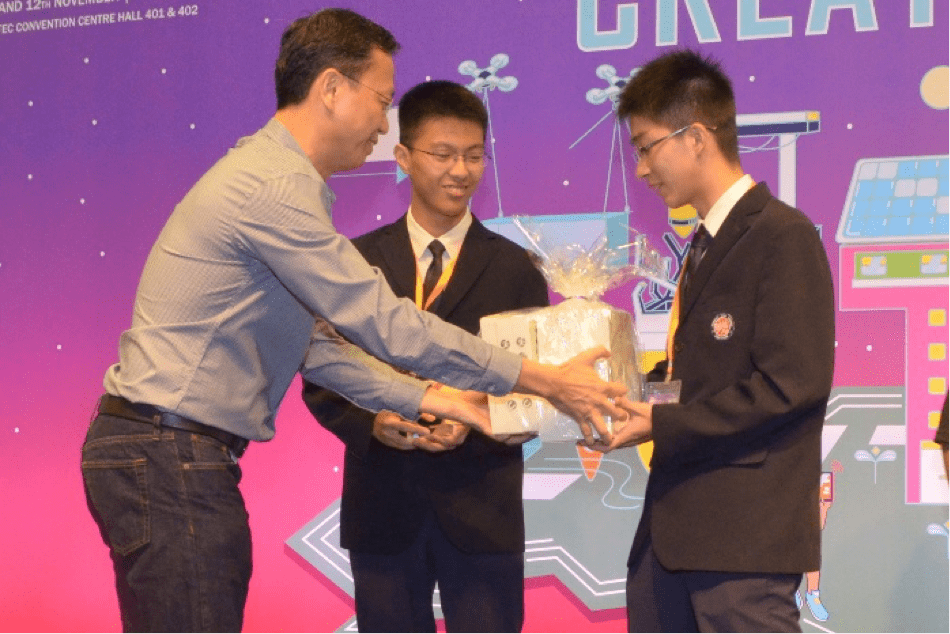
Team Definitely Happenstance
Team Vision
The rest of the teams in the top 10 earned other awards, including Merits, Best Insights, and Most Liked.
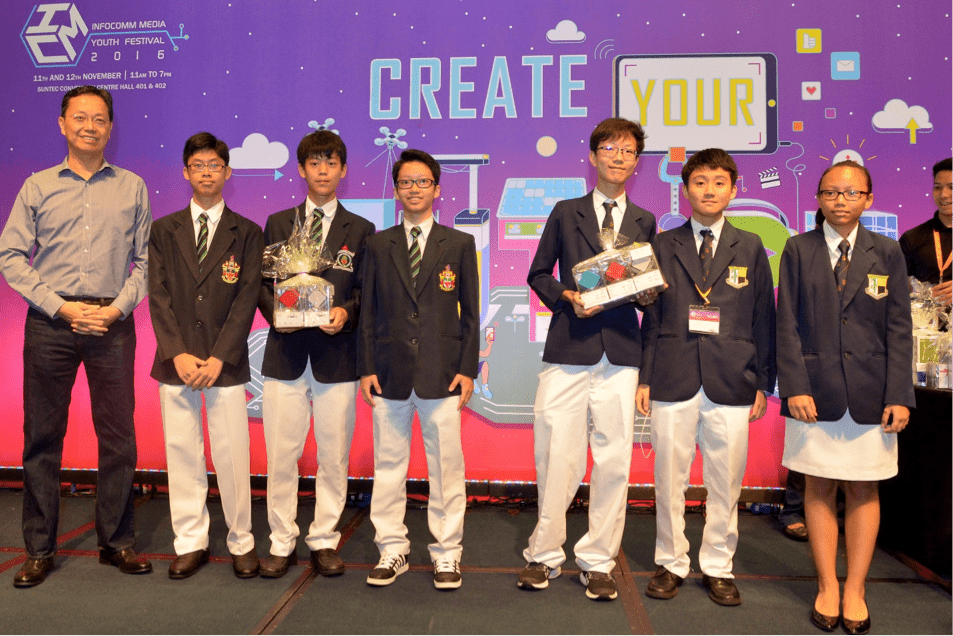
Team Halcyon, left, and Team Barbeque Sauce
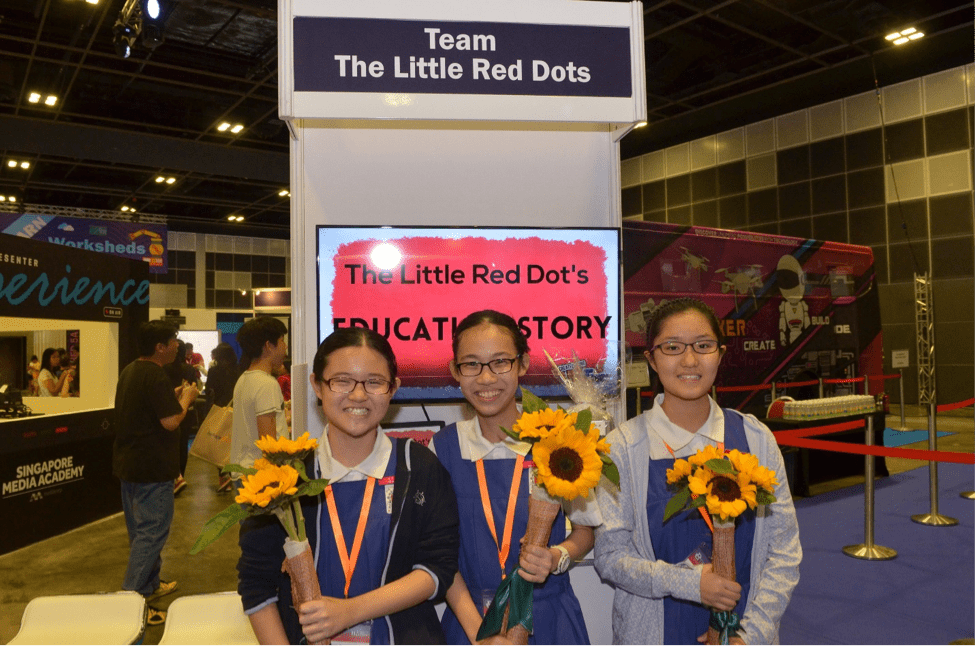
Team The Little Red Dots
Check out the rest of the vizzes here, where you’ll see a gallery of dashboards utilizing custom shapes, annotations, lollipop charts, and much more.
Related Stories

Data Literacy for All: Free data skills training for individuals and organizations
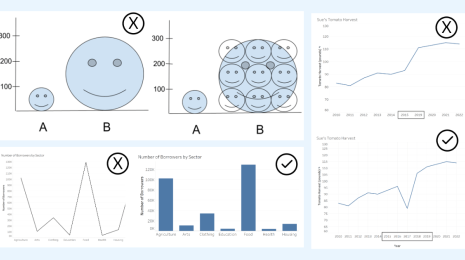
How to Spot Misleading Charts, a Checklist
 November 15, 2023
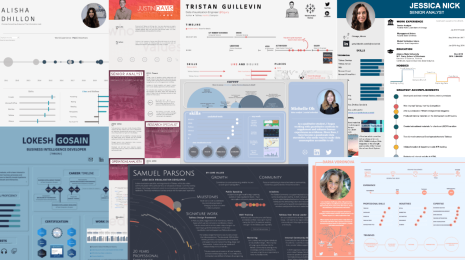
Stand Out in Your Job Search with an Interactive Tableau Resume
 December 8, 2022
Recruiters spend just 6 seconds skimming through each resume. Show off your data visualization skills and stand out in the application process by visualizing and making it interactive in Tableau.
Subscribe to our blog
Get the latest Tableau updates in your inbox.