Visualizing Sustainability with Tableau


I recently had the opportunity to speak at a workshop, put on by Sustainable Seattle, called Visualization Tools for Sustainability. The main focus of the day was on using visual information and cues to convey ideas and persuade an audience.
Burr Stewart, the lead instructor, introduced some of the fundamentals of good visualization, like Schneiderman's "overview, zoom and filter, details on demand", some sustainability basics, and worked through a number of examples that presented sustainability ideas in various ways. Participants wrote down sustainability topics that they would like to see visually presented, as well. Later, Laura Musikanski, Sustainable Seattle's executive director, led the group through an exercise that helped us come up with a picture of what was the most important thing to each of us in our own sustainability work.

My portion of the workshop was about what the sustainability community can do with Tableau Public. I believe that there's a lot of potential for sustainability activists to use Tableau Public in combination with both their own data and publicly available data. My goal was to show the attendees what they could do with Tableau Public and give them some ideas about how they could use it in their organizations. I used some of my favorite sustainability-related vizzes as examples to start out with:
http://dotlinking.blogspot.com/2011/02/mapping-londons-bus-routes.html
http://www.tableau.com/public/gallery/tempdiff
http://www.capitolhillseattle.com/2011/04/27/car-charging-station-data-s...
The electric car charging stations viz sparked the most conversation, perhaps because it was about our local community.
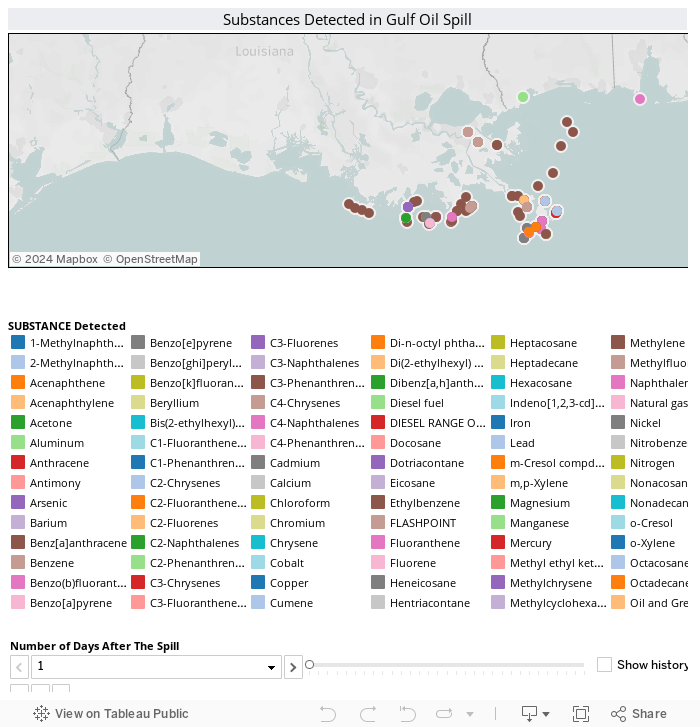
I then moved on to a demo of Tableau Public, in which I created a viz about the BP oil spill using publicly available data from the EPA.
While discussing presentation techniques, Burr quipped "Hopefully, your audience goes and lives their lives, changed forever by your brilliant presentation". I think that all of us here at Tableau have the same hope for each of the vizzes that our customers create!
Subscribe to our blog
Get the latest Tableau updates in your inbox.